The suitability of calibration curves
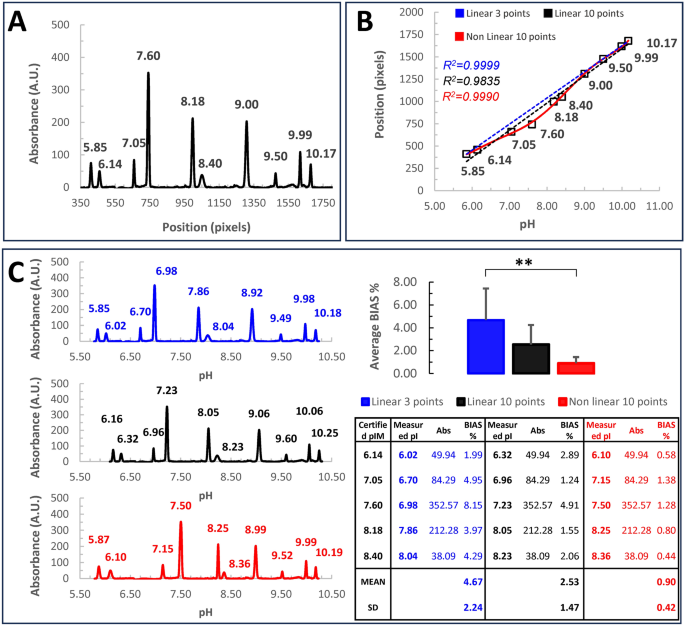
In cIEF establishing an accurate calibration curve is essential. Typically, a mixture of pI-markers is run with the sample, under chosen experimental conditions. The positions of the markers in the electropherogram are identified and correlated with their certified pIs (Fig. 1A). The calibration curve is derived by fitting a model to the data allowing for extrapolation of the pI-values. The obtained pIs are highly reproducible, within and between the experiments (Table S1, Supplementary information).
Setting of the calibration curve. (A) typical icIEF electropherogram obtained using ten certified pI-markers (5.85, 6.14, 7.05, 7.6, 8.18, 8.40, 9.0, 9.5, 9.99, 10.17). The sample mix containing pI-markers and ampholytes is loaded in the capillary and undergoes icIEF, sample mix has been run in twice. Subsequently, the whole capillary is imaged vs the absorbance (the reference system is set at the acidic end of the capillary, corresponding to 0). The resulting electropherogram plots the absorbance vs the position along the capillary (pixels). (B) A typical calibration curve, plots each pI-marker certified value vs its respective position, along the capillary. Linear regressions (blue dotted line: by using only 5.85, 9.99, 10.17 external pI-markers; black dotted line: by employing all the pI-markers) or non-linear regression (6th order polynomial regression, red line, all pI-markers) were applied to the scatterplot. Notice, that Pearson’s determination coefficient is always very near to one (R2Blue 0.9999, R2Black 0.9835, R2Red 0.9990), proving a good adaptation to each model. (C) Unfortunately, in linear regressions, significative errors are introduced in the measure, leading to unwanted biases in the estimation of the pI marker values. The average BIAS % has been quantified in the table inset and plotted as a barplot. Error bars are standard deviations. Maximizing the likelihood of the adaptation to the model allows for minimizing the errors and ensuring a good extrapolation of the pI values for each peak.**p value < 1%.
Nowadays, the software of (i)cIEF devices employs a linear model for the calibration curve, likely due to its simplicity, usually relying on two/three external pI-markers to avoid any superimposition17. To verify the suitability of linear fitting in icIEF, we decided to evaluate this adaptation by running ten pI-markers (certified as 5.85, 6.14, 7.05, 7.6, 8.18, 8.40, 9.0, 9.5, 9.99, 10.17) as samples, by using a 1:1—6% 3.0–10.0/8.0–10.5 Ampholytes (Fig. 1). The obtained values for these markers are reported in Fig. 1C (table inset).
The linear regression yielded a Pearson’s determination coefficient (R2 = 0.9999) very close to one, indicating a strong fit to the model. Nevertheless, the non-linearity in the data is evident (Fig. 1B). Despite this behavior is already well-known, for conventional cIEF18, the consequences of this data non-linearity haven’t been described yet. Although the linear regression assumption holds, it inevitably introduces biases in the measured values. To calculate this distortion, we compared expected and measured pI values of the markers through the regression equations (Fig. 1C). Subsequently, the percentage bias magnitude (BIAS%) for each peak was determined by subtracting the certified values from the measured values, and then dividing by the certified values. These results are summarized in Fig. 1C (table inset). The distortion observed is significant in the range of 6.0–8.5 pH (p-value ANOVA 8.30 E-03; linear 3 points vs non-linear 10 points post-hoc test p-value Bonferroni 9.31 E-03). An error of 8%, as in the worst case obtained, implies that if the true value of a mAb is 7.6, the measured value could vary between 6.99 and 8.21. Considering that pH is measured on a logarithmic scale, this corresponds to a 16-fold difference in absolute magnitude.
A regression that accurately represents the data ideally passes through all the points. As depicted in Fig. 1C polynomial regression can better accommodate the complexity of the data, proving to be an effective option (table inset). However, obtaining the most suitable non-linear regression often strikes a balance between fitting the data well and avoiding overfitting. Thus, choosing the most appropriate condition may involve a complex systematic approach, but in the end, mitigates the bias (Supplementary Information). Consequently, this approach significantly enhances the estimation of pI-values for samples.
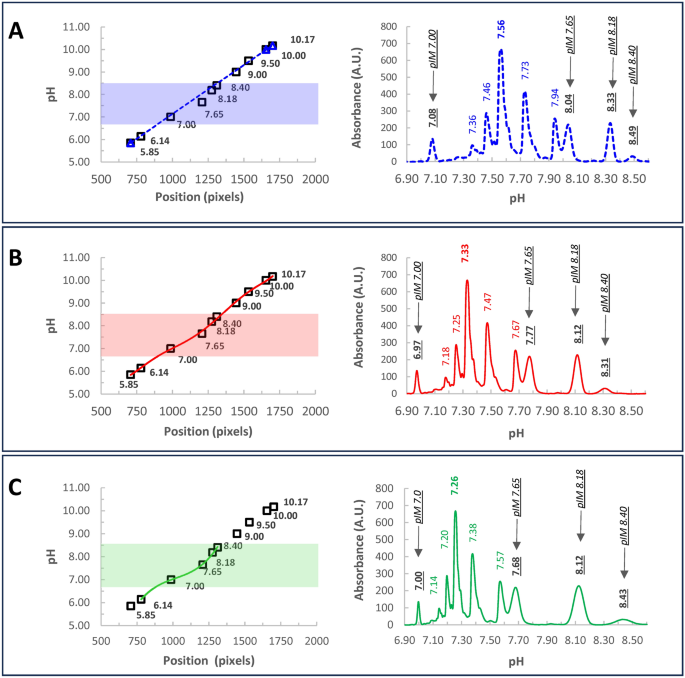
This conclusion is summarized by the following experiment where Infliximab was run in an icIEF experiment together with ten pI-markers spanning through the entire pH-gradient (Fig. 2). Using a linear calibration and three external pI-markers, ProteinSimple Maurice™ revealed a main peak pI of 7.56 (Fig. 2A, blue dash line), consistent with findings by Goyon et al. 201716. However, rescaling the data with a non-linear regression considering all pI-markers (Fig. 2B, red solid line), shifted the main peak near 7.33. Additionally, employing a narrower calibration based on 5 pIM (6.14, 7.0, 7.65, 8.18, 8.40) surrounding the sample (Fig. 2C, green solid line), the non-linear regression gets the Infliximab main species at 7.26. Contextually, we found the measured pI-markers peaks closer to their certified values. A main peak of 7.26 falls within the range computed by Goyon et al. using Vector NTI and MassLynx16. This value also matches the theoretical pI obtained by Prot pi software19, employing the most abundant PTMs described in the literature for Infliximab 2,20,21,22,23 (Supplementary Information).

Infliximab charge variants characterization through icIEF. Infliximab was run together with 10 pI-markers, spanning the gradient. The electropherogram was scaled considering: (A) Linear calibration (left panel, blue dash line) by using three external pI-markers (5.85, 10.0, 10.17), as usually done in our standard icIEF procedures. The correspondent electropherogram is reported in the right panel. (B) A non-linear calibration curve (red line) using ten pI-markers (5.85, 6.14, 7.0, 7.65, 8.18, 8.40, 9.0, 9.5, 10.00, 10.17). (C) A non-linear calibration curve optimized in a narrow window (green line) enclosing the sample and five pI-markers (6.14, 7.0, 7.65, 8.18, 8.40). Notice that, within the considered interval, the green line better approximates the data, as demonstrated by the proximity of measured pI-markers to their certified values (underlined Italic fonts, in the electropherograms). Conversely, under suboptimal conditions (blue and red lines), considerable deviations are evident. This underscores the critical importance of maximizing data adaptation, which not only enhances the accuracy of pI determination for markers but also ensures the Infliximab main peak exhibits a pI that closely aligns with theoretical values derived from the primary sequence (Supplementary Information). On the contrary, by using a poor calibration curve very biased values are observed. In the electropherograms, main peak-pIs are reported in bold. Filled areas in the calibration curves highlight the pH interval considered for the electropherograms.
To summarize, we have shown that the electropherogram scaled according to our analytical instrument software, which relies on linear regression, is affected by calibration errors; however, it is feasible to correct these errors through a non-linear rescaling algorithm, thereby obtaining a more accurate pI determination. From now on, we will use “unbiased” to refer to data where the calibration error has been minimized as much as possible (Supplementary Information).
Assessing the resolution of the method
In Europe, EDQM and the Ph. Eur. Commission, work to develop comprehensive and standardized recommendations for analytical testing strategies in response to stakeholder requests. These recommendations address the diverse needs for manufacturing processes and analytical testing of various classes of biotherapeutics. Such protocols deveoped to control a given class of biotherapeutics (i.e. monoclonal antibodies) are defined as “horizontal standards” and serve as a basis to develop and validate further product-specific standard operating procedures24. According to these “horizontal standards,” the efficacy of peak separation in CVPA carried out by cIEF is effectively measured using “chromatographic resolution,” which is the distance between two peaks of the electropherogram normalized for their average width. Unfortunately, since the resolution is dependent on the calibration curve, is itself biased by the same calibration errors described above. Moreover, this resolution is assumed to be constant within the intervals between the electropherogram peaks, without providing more detailed information along the whole pH range. Here, we propose a more suitable estimation of the resolution that is independent of the specific mAb under study, being based on a fine study of the pH gradient through an accurate internal calibration system consisting of a panel of several pI-markers that will be secondarily run along the sample in the injection. Thus, we named this resolution “a priori,” meaning that we could determine the resolving conditions of the chosen experimental setting independently of the analyte we plan to study and, therefore, choose the best option between different conditions.
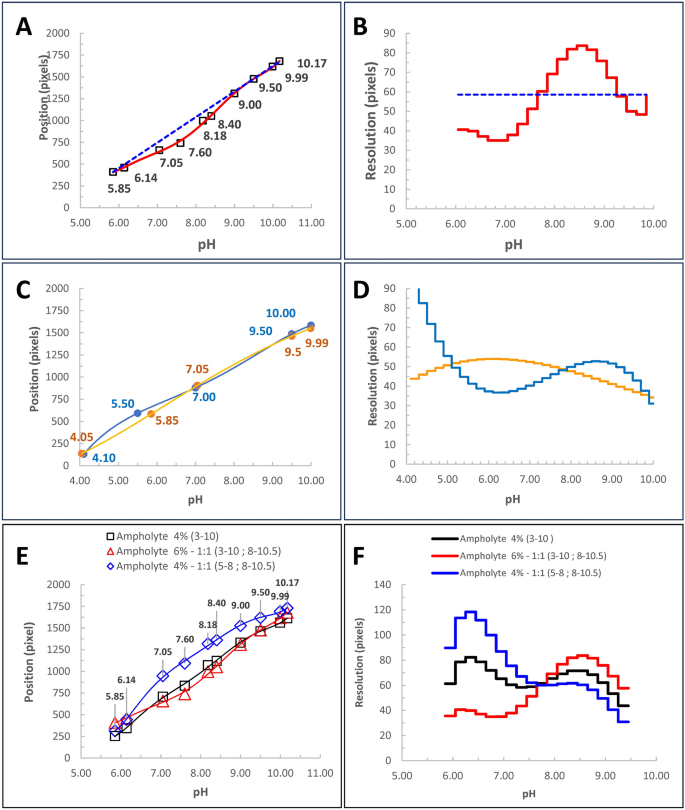
Knowing the optimal calibration curve, we can estimate the distance between consecutive points shifted by the same pH interval (ΔpH) along the gradient. These distances (pixels), represent a measure of the resolution, offering a predictive insight into the separation efficiency for a given molecule. Notably, assuming a linear calibration (Fig. 3A,B—blue dotted line) implies a constant a priori resolution over the pH gradient. On the contrary, the non-linear regression (Fig. 3A,B—red curves) reveals a non-homogeneous resolution along the gradient.

Assessing the Resolution of the Method. (A) Calibration curves of the same icIEF experiment. Certified values of ten pI markers (5.85, 6.14, 7.05, 7.60, 8.18, 8.40, 9.00, 9.50, 10.00, 10.17) are plotted against their positions along the capillary. Linear regression (blue dotted line: using only 5.85, 9.99, 10.17 external pI markers) and non-linear regression (6th-order polynomial, red line, using all pI markers) were applied. (B) Method resolution along the pH gradient, corresponding to A. This graph shows the distance (pixels) between different points of the pH gradient, spanning a ΔpH of 0.2 units. Resolution values were derived from the regressions in A. Notably, linear calibration assumes constant resolution, while non-linear regression allows resolution to vary along the gradient. (C) Calibration curves for two different pI marker sets: ProteinSimple (4.05, 5.85, 7.05, 9.50, 9.99—orange) and SCIEX (4.10, 5.50, 7.00, 9.50, 10.00—blue) diluted in the same parent solution. (D) Resolution corresponding to the marker sets in C. Using the same parent solution highlights that differences in resolution curves are due to solvent effects of the two pI marker formulations, significantly influencing the pH gradient. (E) Ten pI markers (5.85, 6.14, 7.00, 7.60, 8.18, 8.40, 9.00, 9.50, 10.00, 10.17) run in icIEF with different ampholyte stratifications (4% 3–10—black line; 6% 1:1 3–10/8–10.5—red line; 4% 1:1 5–8/8–10.5—blue line). (F) As shown by the calibration curves in E, ampholyte composition strongly impacts resolution along the pH gradient. However, these variations are difficult to predict without systematic experimental design.
Our resolution is useful, for instance, when we need to consider the solvent effects wherein key components such as pI-markers are diluted, which can significantly impact the shape of the pH gradient and the resolution of the method. This scenario is summarized by the experiment depicted in Fig. 3C,D where two different pI-markers’ sets, one from Protein Simple and the other from SCIEX, have been dissolved in two vials of the same parent solution. The choice of different pI markers is sufficient to affect the two calibration curves and thus the resolution.
As mentioned above, in cIEF, the configuration of this pH gradient is the most critical factor for successfully identifying all isoforms as distinct peaks. While certain variables influencing the gradient shape are beyond the operator’s control, such as the capillary embedded in a closed cartridge, other parameters can be adjusted for specific purposes, allowing the device to operate under customized conditions. Above all, formulation, concentration, and stratification of carrier ampholytes are the most significant (Fig. 3C,E). They are usually supplied as ready-to-use mixtures, and unfortunately, their composition is not disclosed. The only information typically provided is the range of the pH gradient generated. According to this information, ampholytes can be classified as wide- or narrow-range. In Fig. 3F, by using the same mixture of ten pI-markers we evaluated the resolution of the pH gradient against different ampholyte conditions. Generally, we didn’t find a uniform resolution throughout the whole pH range but rather there are intervals where it is better than others. We always observed the poorer resolutions near pH 7 and above 9. The knowledge of these effects raises the idea that whatever method should be accurately designed considering all the variables affecting the resolution of the system.
The development of icIEF mAbs-tailored methods through an unbiased experimental design
Recently, a new trend has emerged aimed at adapting and transferring previously validated methods to different technological tools and developing platform methods for controlling mAb-based drugs to harmonize different analytical procedures. This is reflected in recent texts published by international standardization bodies, such as European Pharmacopoeia17, to be used by both manufacturers and OMCLs. In this context, developing a method able to reveal the identity of biotherapeutics where no reference standard (RS) is available, is key in the fight against the counterfeiting of biological medicinal products (BMPs). In all these cases, OMCLs that currently carry out analytical controls should be able to perform an easy and independent evaluation of the BMPs’ quality and efficacy. To pursue such an approach, the only possibility is to carry out an UED, which is applicable to any specific drug under study, independently of the device to analyze them, or of the operators.
Following this strategic approach, it becomes fundamental to examine the variables that significantly influence the outcome. We considered that key input variables impacting the method’s resolution include: the total percentage of ampholytes, ampholyte ratio, pH, voltage, and separation time. We posit that an optimal method should adhere to an ideal design capable of discerning conditions for achieving the highest resolution possible across the specified pH range, regardless of the sample. This condition can only be fulfilled through a multiparametric analysis of the resolution, treated as a scalar function of multiple real input variables, changing simultaneously. Within each pH interval, this function should exhibit relative maxima whose coordinates represent the optimal compromise for achieving the desired resolution.
Consequently, we conducted a multivariate experiment utilizing a sample consisting of ten certified pI-markers (ranging from 5.85 to 10.17) carrying out icIEF, under various combinations (N = 45) of the input variables: (i) Total ampholyte percentage (4%, 6%, 8%); (ii) narrow-range ampholyte ratio (pH 5–8/pH 8–10.5 = 0.33, 0.66, 1.00, 1.66, 3.00); (iii) separation times (9.0’, 10.5’, 12.0’); (iv) pH (each pI marker peak in the electropherograms flags the pH value that was present at that point of the gradient at the end of the experiment).
The only output variable is the resolution. Therefore, the “resolution function” is the scalar relationship defined in a set of the input real variables (domain) returning its values in a set of real numbers (codomain). To study this function, by a multiparametric analysis, our first concern was to achieve a good sampling of the domain, so we designed all the combinations of the input variables reported above to achieve this purpose.
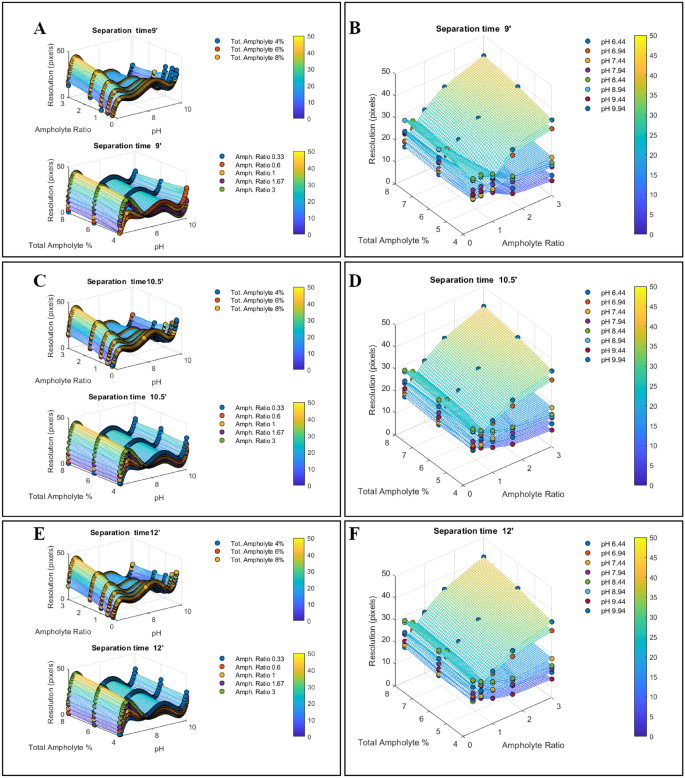
To better show the results we plotted the resolution function against the input variables, two at a time (Fig. 4). We plotted the simultaneous dependence of the resolution on pH and the specified ratio of pH 5–8/pH 8–10 narrow range ampholytes or total ampholyte percentage in Fig. 4-panel A, C, E; while, the effects of the simultaneous variation of ampholyte ratio and total ampholyte percentage in different set of pH, is displayed in Fig. 4-panel B, D, F. To be noticed, the focusing time effects on the resolution can be analyzed by a direct comparison of the results summarized in Fig. 4 panels A, C, E, or panels B, D, F.

The development of a transversal unbiased method for mAbs icIEF by studying the resolution function. We performed a multivariate icIEF experiment where 4 input variables are changing together, while we measure the resolution of the methods along the pH gradient. In each injection a sample consisting of a mix of ten pI-markers (5.85, 6.14, 6.61, 7.05, 7.40, 7.90, 8.40, 9.00, 9.50, 9.99, 10.17) is run under an array of different input variables: (i) total ampholytes percentage (4%, 6%, 8%); (ii) narrow range pH 5–8/pH 8–10.5 ampholytes ratio (0.33, 0.66, 1.00, 1.66, 3.00); (iii) separation times (9.0’, 10.5’, 12.0’). Due to the presence of the pI-markers in each injection, we performed an internal optimized calibration allowing us to define the shape of the pH that was present in the capillary at the end of the measure. This pH is independent of the measure since the pI-markers are only flags of the pH gradient that affected the experiments. (A,C,E) Based on the calibration curves, we computed the resolutions every 0.05 ΔpH units from pH 6 to pH 10, for each array of variables, these data are presented as scatter plots of the different arrays of variables presented in two at a time. The remaining input variables are reported as different color datasets superimposed on the same graph. The effects of the migration times can be observed by a direct comparison of panels (A,C,E). (B,D,F) These data show the average resolution in simultaneous variations of total ampholyte percentage and narrow range pH 5–8/pH 8–10.5 ampholytes ratio, in defined slots of pH. These scatterplots demonstrate that pH and ampholyte ratio strongly affect the resolution of the methods. The effects of the migration times can be observed by a direct comparison of panels B, D, F. All the scatter plots were interpolated by non-linear polynomial surfaces to obtain each corresponding-colored mesh, these are the 3D representations of the resolution functions. The Colormaps highlight the resolution values by color-coded scales.
Overall, our results strongly demonstrate that the resolution function is not a linear relationship and that both pH and the ratio of pH 5–8/pH 8–10.5 narrow-range ampholytes mainly affect the resolution by directly shaping the gradient. On the contrary, both the total percentage and the focusing time only slightly affect the overall resolution. However, at the tails of the gradients sometimes this scenario could change. We also noticed that in all the cases the lower resolution occurs near pH 7.5, probably due to the narrow range ampholyte-specific composition (unknown to us). Since a similar effect has been observed even by using only 3–10 wide-range ampholytes Fig. 3 (black trace), this effect cannot arise from a gap between the narrow-range ampholytes but is rather dependent on carrier molecule enrichment.


