Isolation and characterization of Indanone derivative
Indanone derivative was isolated as a white solid having melting points 161â163 °C. The EI-MS indicated a molecular ion peak at m/z 290.133 [M+] with molecular formula C16H18O5. Our research group previously identified the Indanone derivative’s chemical structure using 1H-NMR and C13-NMR spectroscopy11.
Effect of indanone derivative on heat-induced hemolysis
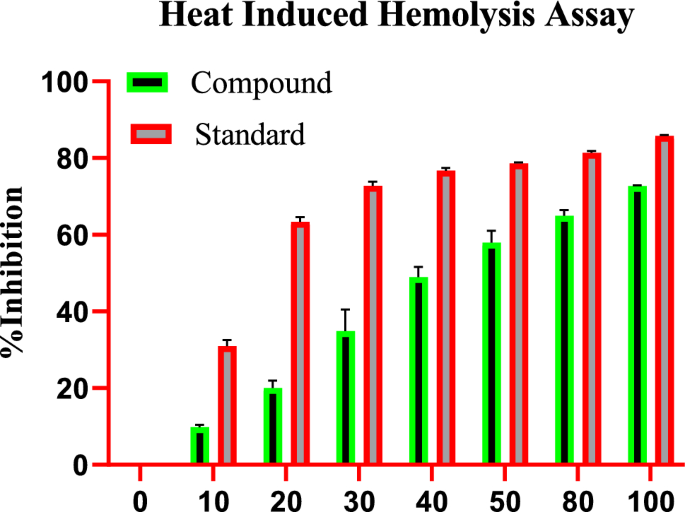
High temperature results in the lysis of red blood cells (RBC), while the impact of indanone derivative on RBC stabilization was assessed in this study. Indanone derivative momentously aided in inhibiting heat-induced lysis of the RBC membrane in a dose-dependent manner; diclofenac sodium was used as the standard drug. Various concentrations of indanone derivative were used at 10, 20, 30, 40, 50, 80, and 100 µM, which showed 9.12â±â0.75%, 17.97â±â1.05%, 28.44â±â1.84%, 45.91â±â0.42%, 54.65â±â3.51%, 63.21â±â1.72%, and 72.82â±â4.36% of inhibition respectively. The compound expressed 54.69 as the IC50 value. For the standard group, the diclofenac sodium was used at 10, 20, 30, 40, 50, 80, and 100 µg, which showed 32.66â±â1.93%, 64.23â±â1.34%, 73.80â±â2.88%, 77.38â±â3.12%, 78.57â±â0.81%, 80.95â±â4.64%, and 85.71â±â2.89% of inhibition respectively. The minimum rate inhibition of the indanone derivative was at 10 µM, which was 9.12â±â0.75%. While the maximum rate of inhibition was shown at 100 µM, which was 72.82â±â4.36%, as shown in Fig. 1.
Effect of indanone derivative on heat-induced hemolysis assay.
Effect of different concentrations of indanone derivative on glucose uptake by yeast cells in glucose solution
To study the effect of indanone derivative on the glucose uptake by yeast cells in 5 mmol glucose solution, various concentrations of indanone derivative (from 5 to 100 µM) were incubated. The compound has increased the uptake from 5.16â±â1.28% to 76.59â±â1.617% in the yeast cell at 5 µM and 100 µM concentrations, as shown in Fig. 2, respectively, compound reveals a dose-dependent increase in uptake.
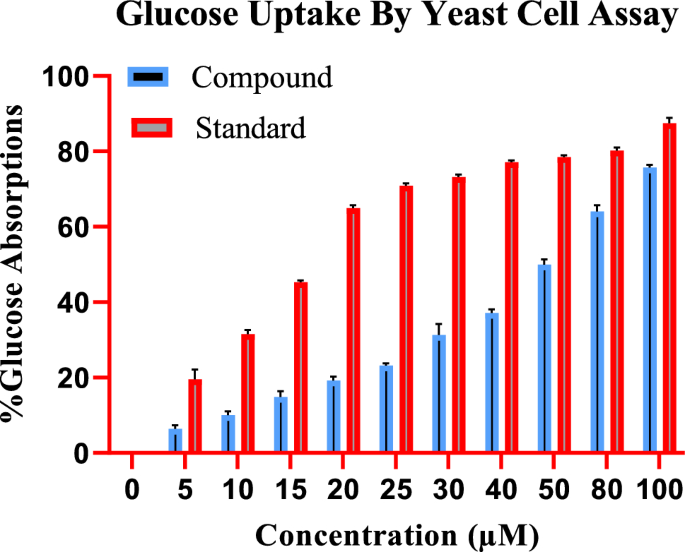
Effect of indanone derivative on glucose uptake by yeast cells in glucose solution (Glucose Yeast Uptake Assay/5Â mM).
The standard drug (Metformin) also has a pronounced effect on glucose uptake by the yeast cells, with an increase from 21.45â±â0.88% to 88.65â±â0.42% in glucose uptake at 5 µg and 100 µg concentrations of metformin, respectively. Figure 2 shows that the activity of the indanone derivative has followed the standard.
Alpha-amylase inhibition assay
Remarkable results were obtained assessing the Compound impact on the α-amylase inhibitory activity at various concentrations. The inhibitory potential of the compound was determined with different concentrations, i.e., 10, 20, 40, 60,80, and 100 (µM), for which inhibition percentage was recorded as 9.80â±â0.54%, 13.07â±â1.25%, 28.90â±â1.87%, 46.12â±â2.00%, 65.88â±â1.64%, and 72.85â±â1.19% respectively, with IC50 value of 46.37 µM. The standard drug, acarbose at 100 µg, expressed the highest inhibition at 87.08â±â1.328%. With the increase in concentrations, a regular rise in the α-amylase inhibition was observed, indicating dose-dependent inhibition. Figure 3 shows that the activity of the compound has followed the standard.
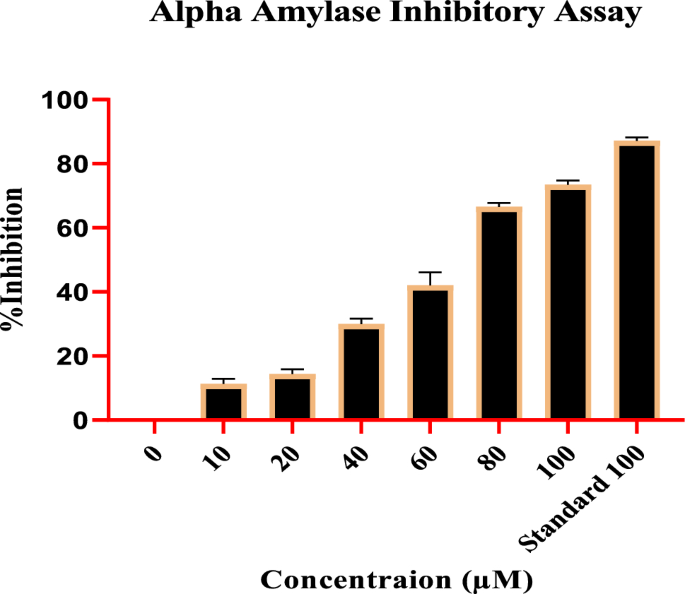
Compound effect on α-Amylase inhibitory potential at various concentrations.
Molecular docking
We docked the indanone derivative into the binding site of four molecular targets responsible for diabetic and inflammatory activities. The target enzymes were downloaded from the protein data bank (PDB) and docked using Molecular Operating Environment (MOE 2016.08) Software. 5â² Adenosine monophosphate-activated protein kinase (AMPK), a key target to design drugs against obesity, metabolic syndrome, and type 2 diabetes, was downloaded with PDB ID 3AQV. While anti-inflammatory targets, two cyclooxygenase enzymes (COX-1 and COX-2), and tumor necrosis factor-alpha (TNF-α) were downloaded, PDB accession codes 1EQG, 1CX2, and 2AZ5, respectively. Prepared enzymes and native ligands were redocked into the binding sites of their respective enzymes. The purpose is to validate the docking protocol. Only validated docking procedures (RMSDâ<â2.0 à ) were adopted for further docking runs. The computed RMSD values for experimental and redocked native ligands in the binding sites of downloaded enzymes have been presented in Table 1.
Two-dimensional (2-D) interaction plots of indanone into the binding sites of anti-inflammatory targets COX-1, COX-2, and TNF-α are shown in Fig. 4. The studied compound interacts with amino acid residues in the binding site COX-1 via 2 hydrogen bond interactions. Ile523 and Ser530 form hydrogen bond interactions with a hydroxyl group and carbonyl oxygen, respectively (Fig. 4a). Ile523 is a specific residue in the binding site of COX-1. The computed binding energy values of the native ligand and indanone derivative in the binding site of COX-1 are ââ6.28 and ââ5.48 kcal/mol, respectively. While in the binding site of COX-2, indanone derivative oriented deep into the binding site of COX-2 specific binding site residues Phe518 via ÏâÏ stacking interactions and Ïâsulfur interactions with Met522 (Fig. 4b). The computed binding energy values of the native ligand and indanone derivative in the binding site of COX-2 are ââ9.65 and ââ7.51 kcal/mol, respectively. A 2-D interaction plot of the compound in the binding site of TNF-α is shown in Fig. 4c. The hydroxyl group forms hydrogen bond interactions with Gly121, while Tyr59 and Tyr151 form ÏâÏ stacking interactions with the phenyl ring of the indanone (Fig. 4c). The computed binding energy values of native ligand and indanone derivative in the binding site of TNF-α ââ7.08 and ââ6.71 kcal/mol, respectively.
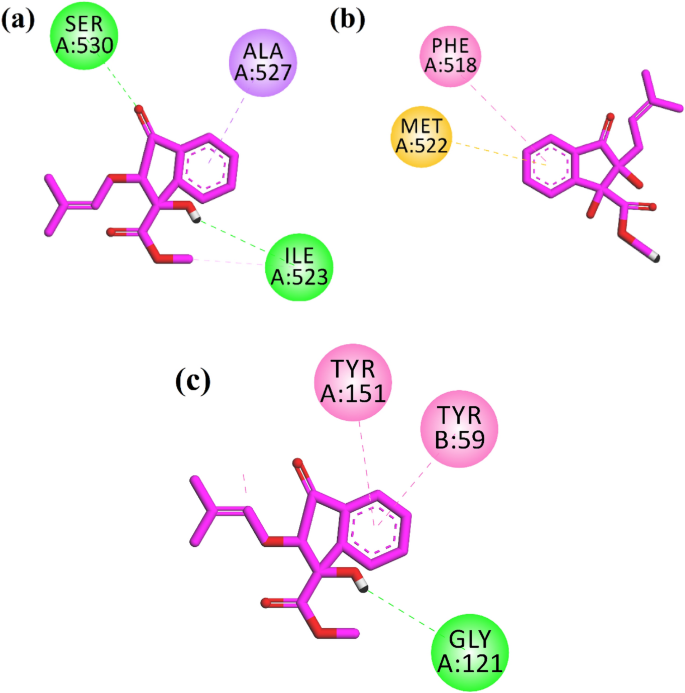
2-D interaction plots of isolated indanone into the binding site of (a) COX-1 (1EQG), (b) COX-2 (PDB IDâ=â1CX2) and (c) TNF-α (PDB IDâ=â2AZ5).
Next, we docked the compound into the binding site of the anti-diabetic target AMPK. Figure 5a shows the interaction plot of the native ligand. It interacts with Val96 through hydrogen bond interaction. Tyr95 and Met 93 interact via hydrophobic interactions (Fig. 5a). Isolated indanone derivative forms two hydrogen bond interactions with Glu100 and Asp103. While the phenyl ring forms ÏâÏ interactions with Gly99 and ÏâÏ stack interactions with Tyr95 (Fig. 5b). The computed binding energy values of native ligand; 6-[4-(2-piperidin-1-ylethoxy)phenyl]-3-pyridin-4-ylpyrazolo[1,5-a]pyrimidine, also known as Dorsomorphin. It is a potent, selective, reversible, and ATP-competitive inhibitor of AMPK, and indanone derivative in the binding site of AMPK are ââ8.39 and ââ7.06 kcal/mol, respectively.
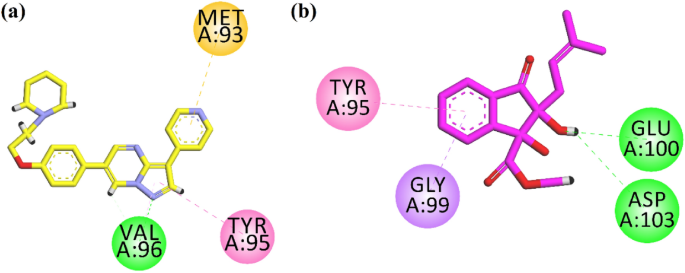
2-D interaction plots of (a) native ligand Dorsomorphin and (b) isolated indanone in the binding site of AMPK (PDB IDâ=â3AQV).
Molecular dynamics simulation
The docking study is static, single-picture explanation of the target proteinâligand complex interaction. For further detailed analysis of proteinâligand complex (ICX2 and 1EQG) molecular dynamics simulations was performed using Desmond software1. The best pose of the docking study based on interaction and S-score was selected to investigate the structure and dynamics of target protein and ligand. The conformational changes, flexibility, dynamics of target proteins (1CX2 and 1EQG), and, most importantly, the effect of ligand binding to the proteins were evaluated in terms of root mean square deviation (RMSD) and root mean square fluctuation (RMSF). Ligand RMSD, radius of gyration (rGyr): intramolecular hydrogen bond (intraHB), Molecular surface area (MolSA), Solvent accessible surface area (SASA), Polar surface area (PSA) parameter were used to check and illustrate the consistency and orientation of our compound deep inside the receptor site of target protein (1CX2 and 1EQG).
Additionally, RMSF graph and analyses were used to demonstrate the stability of the structure, atomic dynamics, and amino acid versatility during the interaction of target protein (1CX2 and 1EQG) with a hit.
The RMSD of the 1CX2âligand complex revealed a little deviation at about 60 ns, where the deviation was between 2 and 3 à ; after that, the system became equilibrated throughout the experiment (Fig. 6). When the trajectories were examined, it was discovered that both of the structures 1CX2 and 1EQG had a stable state, ligands remained deep inside the binding cavity (receptor site) and produced substantial interactions, and that the backbones were consistent. Conformational adjustments could be the reason for the variance in results.
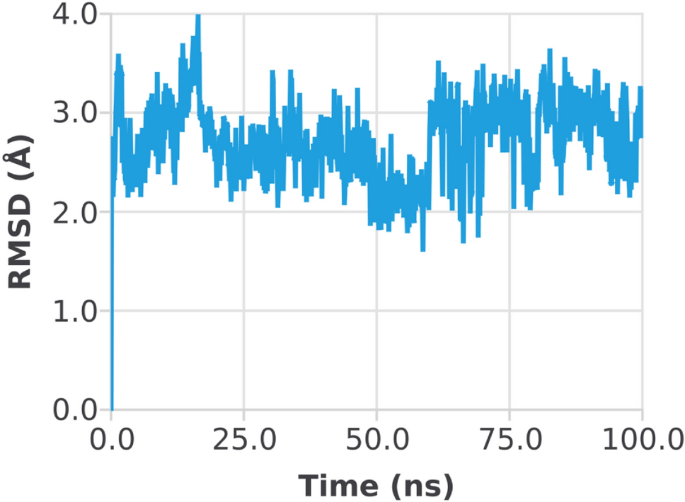
Root mean square deviation (RMSD) plot of 1CX2 proteinâligand (complex).
The RMSD of the 1EGQ-Complex exhibited a variation from 2 to 3 à at roughly 60 ns, with a tiny flip from 3 to 4 nm, although overall deviations were within range (Fig. 7). The RMSF graph peaks of 1CX2 shows stability in term of fluctuation in most of the of part of the protein during the simulation but little fluctuation was shown from residues 30 to 50 and 240 to 260. On the other hand, the 1EQG RMSF plot shows slight fluctuation between residues 30â40 and 300â340. The binding of compound for 1CX2 and 1EQG lowered the value of RMSF (<â3 à ), suggesting that the ligand-enzyme complexes are stable (Figs. 8, 9).
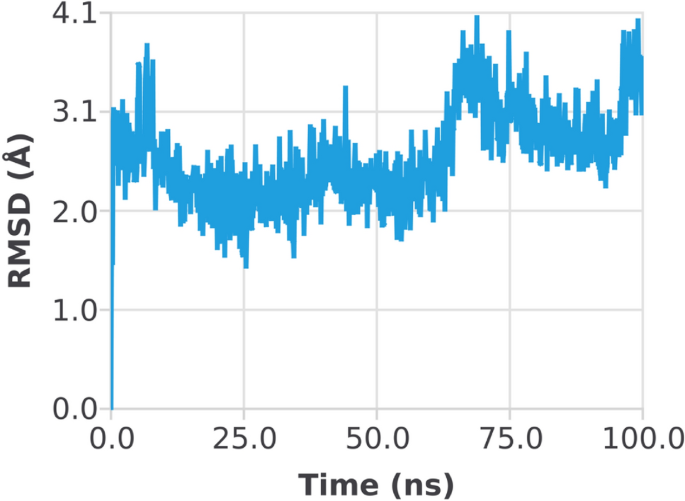
Root mean square deviation (RMSD) plot of 1EGQâligand (complex).
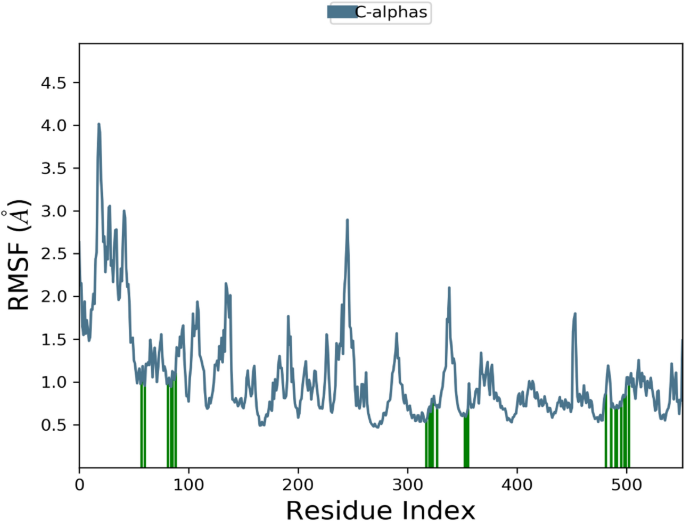
Root mean square fluctuation (RMSF) plot of 1CX2âligand (complex).
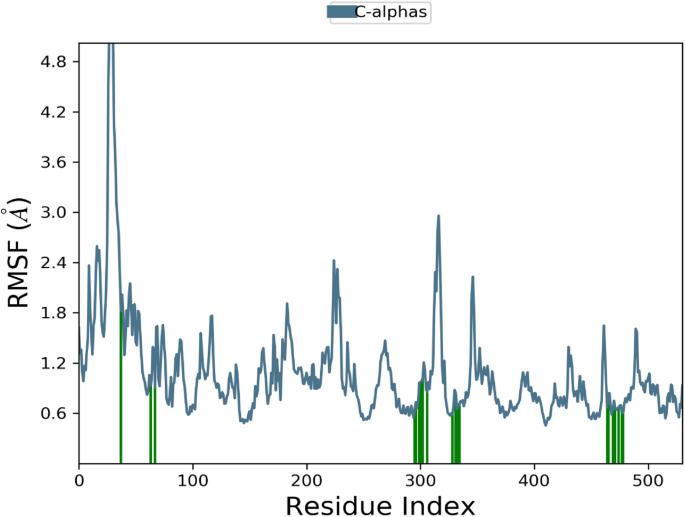
Root mean square fluctuation (RMSF) plot of 1EQGâligand complex.
The influence of indanone derivative in target protein was studied in complex with 1CX2. To analyze the position, stability, and orientation of our compound deep inside the receptor site of the target protein, six different parameters were determined. RMSD of ligand was compared with the reference conformation (typically the first frame is used as the reference, and it is regarded as time tâ=â0). The graph shows stability with some variation from 0â20 ns. The intraHB, MolSA, SASA, and PSA plots also showed the consistency of the ligand during the whole simulation process. The MolSA, SASA, and PSA plots for the ligand were consistent, and curves were smooth throughout the 100 ns simulation. (Fig. 10).
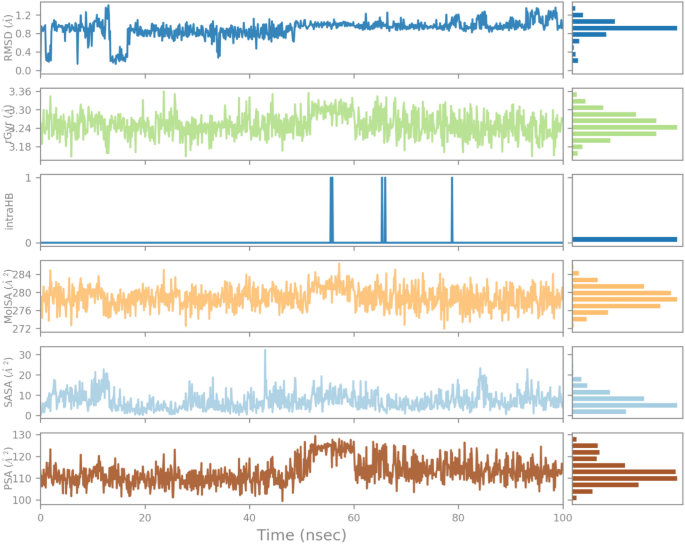
Variation in the ligandâs properties in 1CX2-complex concerning time during the course of 100Â ns simulation.
As shown in Fig. 11, the RMSD of the ligand (indanone derivative) was nearly 1.2 à from almost 0â20 à and was consistent till 100 ns. The rGyr value of ligand in the binding was from 3.18â3.30 à till the end of the simulation. The constant values indicate steady behavior. The intraHB, MolSA, SASA, and PSA plots also showed the consistency of the ligand during the whole simulation process. The MolSA, SASA, and PSA plots for the ligand were consistent, and curves were smooth throughout the 100 ns simulation. Similarly, the RMSD of the ligand in the 1EGQ-complex was roughly 1.2 until 100 ns. Until the completion of the simulation, the rGyr value of the ligand in the binding ranged from 3.18 to 3.30. Stable values suggest consistent behaviour. The intraHB, MolSA, SASA, and PSA graphs further demonstrated the ligand’s constancy throughout the simulation phase. The ligand’s MolSA, SASA, and PSA graphs did not show a lot of variation, and they remained steady throughout the simulation.
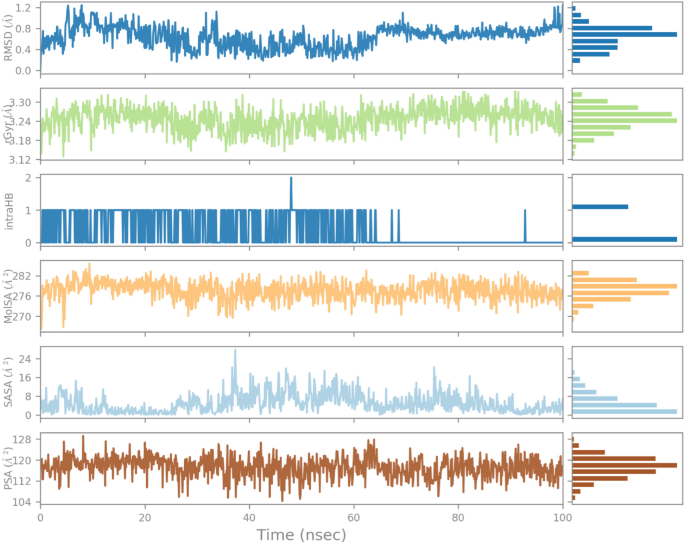
Variation in the ligandâs properties in 1EGQ-complex concerning time during the course of 100Â ns simulation.
These curves indicated the consistency of the ligands in the binding pocket over the simulation trajectory (Fig. 11).
In-silico pharmacokinetic predictions
In-silico pharmacokinetic properties were predicted by using the Admet-SAR online server. The results are tabulated in Table 2. The results showed that the indanone derivative is bioavailable and absorbed in the human intestine. Moreover, it is non-carcinogenic and also not able to cause mutagenesis. The acute oral toxicity of the compound is predicted to be in Category III, which is considered safe for human consumption according to the Organization for Economic Cooperation and Development (OECD) guidelines.


