Predicted model and statistical analysis
For mixed microalgal-bacterial cultures, multiple factors can affect algal cultivation and productivity. Previous studies have mainly investigated a single factor and its effect instead of two or more factors. To overcome this limitation, the interactions between the inoculum ratio of bacteria to microalgae, CO2 concentration, light intensity, and harvest time, as well as their synergic impact on microalgal biomass and lipid productivity were investigated in this study. This was done by using the central composite statistical model of RSM design. Because the range of microalgal biomass and lipid productivity changed dramatically from 2.1 × 10⁵ to 1.9 × 10⁷ cells/mL and 2.8 × 10² to 3.6 × 10¹² Total FL/mL respectively (Table 1), a square root power transformation y′ = √(y + k) was applied (when y + k ≥ 0) for such vigorous change of responses where minimum and maximum output ratios were more than 1018. By using multiple regression analyses of the experimental results, Eqs. (1) and (2) were developed to predict the second order polynomial response of microalgal biomass and lipid productivity.
$$ \begin{aligned} Sqrt \, \left( {Microalgal \, Cells} \right) \, & = \, + 2861.01 \, + \, 454.75A \, + \, 243.75B \, + \, 197.5 \, C \, + \, 285.03D + \, 38.67AB \, \\ & \quad + \, 83.44AC \, + \, 118.43AD \, – 44.18 \, BC \, – \, 53.16BD \, + \, 70.54CD \, \\ & \quad – \, 26.56{A^2} – \, 242.22{B^2} – \, 164.84{C^2} – \, 415.71{D^2} \\ \end{aligned} $$
(1)
$$ \begin{aligned} Sqrt \, \left( {Lipid \, Productivity} \right) \, & = \, + 1.24 \times {10^6} + \, 1.36 \times {10^5}A + \, 1.17 \times {10^5}B \, – \, 1.65 \times {10^5}C \, \\ & \quad + \, 2.43 \times {10^5}D \, – \, 41.77AB \, — \, 1.19 \times {10^4}AC \, + \, 1.61 \times {10^5}AD \, \\ &\quad+ \, 8.44 \times {10^4}BC + \, 2.62 \times {10^4}BD \, – \, 2.76 \times {10^5}CD \, + \, 8.45 \times {10^4}{A^2}\\ & \quad – \, 2.16 \times {10^5}{B^2} – \, 1.83 \times {10^5}{C^2} – \, 2.44 \times {10^4}{D^2} \\ \end{aligned} $$
(2)
where A is the inoculum ratio of bacteria to microalgae, B is light intensity, C is CO2 concentration, and D is harvest time.
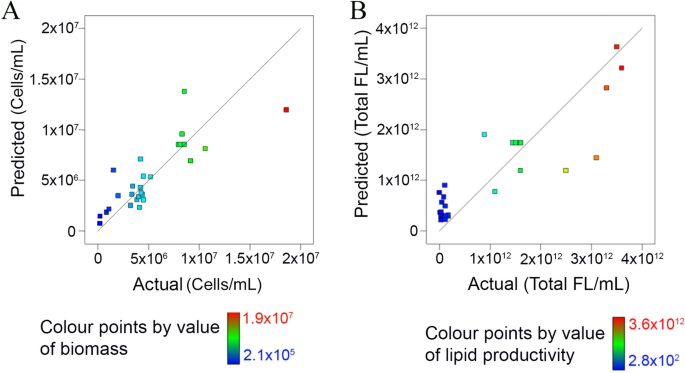
The p values of the predict models were low (0.01 for microalgal biomass and 0.02 for lipid productivity) (SI Table S1a,b), indicating that the fitness of the predicted model was statistically significant. As shown in Fig. 1, the correlation between predicted and actual data for biomass and lipid is significant with a high R2 value (0.75 for cell count and 0.74 for lipid) (SI Table S1a,b). For the impact of cultivation conditions on biomass and lipid productivity, significant parameters were those with p values < 0.05. Inoculum ratio (A) (p = 0.002), harvest time (D) (p = 0.031), quadratic effect of light intensity (B2) (p = 0.047) and harvest time (D2) (p = 0.002) (SI Table S1a) have significant impacts on microalgal biomass. Harvest time (D) (p = 0.016), interactive effect of CO2 concentration with harvest time (CD) (p = 0.023), quadratic effect of light intensity (B2) (p = 0.020), CO2 concentration (C2) (p = 0.045) and harvest time (D2) (p = 0.010) (SI Table S1b) have significant impacts on lipid productivity.
High closeness of the fitted regression between the actual and predicted biomass (A) and lipid productivity (B).
Microalgal biomass
The maximum microalgal biomass (1.7 × 10⁷ cells/mL with the desirability value of 0.939) was obtained with 100% of inoculum ratio (bacteria to microalgae), 4.1% of CO2, 204.8 µmol/m2/s of light intensity, and 10.4 days of harvest time (Table 2). Figure 2A–F illustrates the impact of each cultivation parameter, as well as the interactive impact of different parameters on microalgal biomass yield based on the 3D response surface plots of the RSM predicted model.
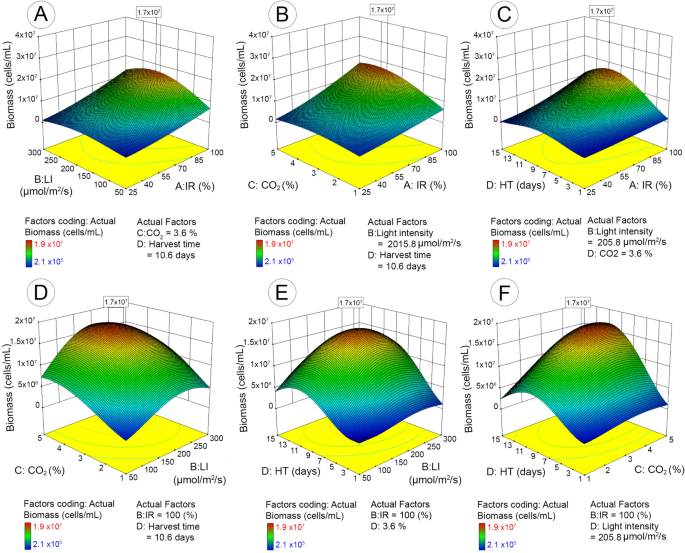
3D surface response and contour line of central composite design showing the mutual effect of different parameters on microalgal biomass with maximum response value in boxes. IR (inoculum ratio), inoculation ratio of bacteria to microalgae (25–100%); LI (light intensity), 50–300 µmol/m2/s; HT (harvest time), 1–15 days; CO2, CO2 concentration in mixed CO2/air gas 1–5% (v/v).
The inoculum ratio of bacteria to microalgae had significant impact on microalgal biomass yield. Increasing inoculum ratio from 25 to 100% significantly enhanced microalgal cell proliferation. The maximum biomass was observed when inoculum ratio was maximum (bacteria/microalgae: 100%) (Fig. 2A–C). The impact of inoculum ratio appeared to be more apparent at optimum conditions for the remaining cultivation parameters (CO2, light intensity, and harvest time). The other significant factor was light intensity (Fig. 2A,D,E). Microalgal biomass was enhanced with increase of light intensity up to 206 µmol/m2/s; further increase had negative impact, thus resulting in a slightly declined biomass. In addition, the impact was more significant in exponential and stationary stages than lag- and decline-phases. Unsurprisingly, harvest time was another significant parameter that affected microalgal yield. Microalgal yield boosted from the exponential stage (starting from 2 to 3 days), reached to a maximum biomass yield at 10.4 days, and then declined. In contrast, the response of microalgal biomass marginally varied with the factor of CO2 supply.
Since microalgal biomass productivity depends on not only microalgal cell number but also cell size, it is necessary to examine changes of microalgal cell sizes under different conditions. Flow cytometry is a powerful tool in analyzing cell sizes at a cellular level. By analyzing forward scatter signal of the flow cytometry histogram, we were able to compare microalgal cell sizes at different cultivation conditions. The larger forward scatter is, the bigger the cell size is. We compared the impact of inoculum ratio, CO2, and light intensity respectively on microalgal cell size by keeping other cultivation conditions at an optimal level. With other conditions held constant, increasing bacteria inoculum clearly enlarged microalgal cell size (Fig. 3C,D). When the ratio of bacteria to microalgae increased from 43.74 to 81.25%, the forward scatter signals of microalgae cells shifted from 1,000,000–4,000,000 to 2,500,000–7,000,000. The comparison of different CO2 conditions (Fig. 3A,D) indicate that enhancing CO2 supply from 2 to 4% did not significantly increase the average size of microalgal cells. Higher CO2 concentration actually promoted a large number growth of small-size microalgae cells (as evidenced with the high peak in the forward scatter of 2,500,000–4,500,000 in Fig. 3D). Light intensity had a significant impact on microalgal cell size (Fig. 3B,D). The forward scatter signals of microalgal cell were 2,500,000–7,000,000 under high light intensity (237.5 µmol/m2/s) but only 1,000,000–3,000,000 under low light intensity (112.5 µmol/m2/s).
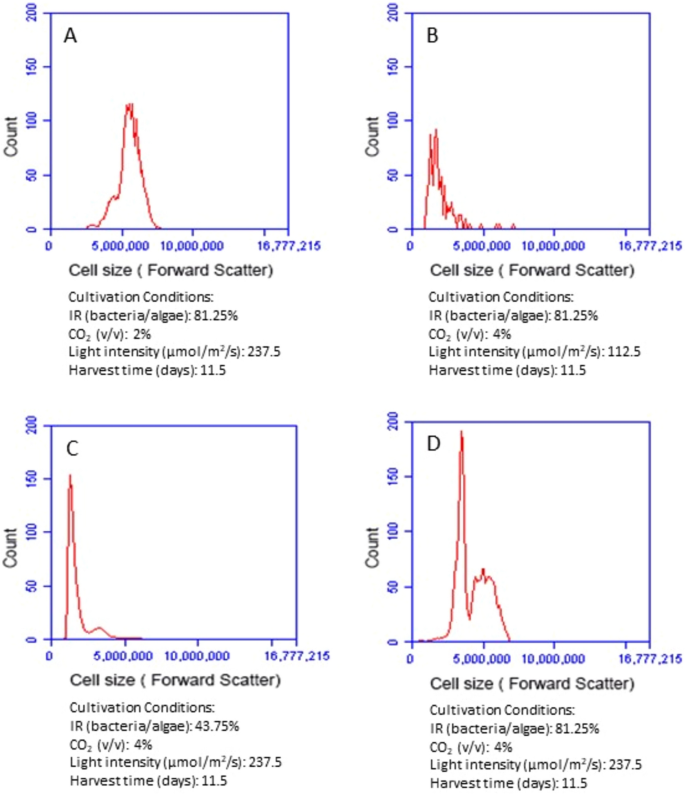
Comparison of forward scatter signals of the flow cytometry histogram showing microalgal cell sizes at different cultivation conditions. IR (inoculum ratio), inoculation ratio of bacteria to microalgae.
Lipid productivity
The maximum lipid productivity (3.6 × 10¹² Total FL/mL with the desirability value of 1.0) was obtained with 98.6% of inoculum ratio (bacteria to microalgae), 2.8% of CO2 concentration, 235.4 µmol/m2/s of light intensity, and 10.1 days of harvest time (Table 2). Figure 4A–F illustrates the impact of each cultivation parameter, as well as the interactive impact of different parameters, on microalgal lipid productivity yield based on the 3D response surface plots of the RSM predicted model.
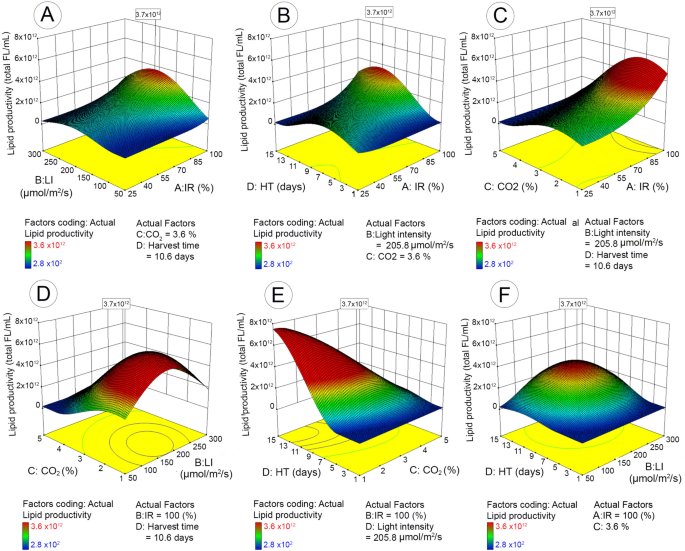
3D surface response and contour line of central composite design showing the mutual effect of different parameters on microalgal lipid productivity with maximum response value in boxes. IR (inoculum ratio), inoculation ratio of bacteria to microalgae (25–100%); LI (light intensity), 50–300 µmol/m2/s; HT (harvest time), 1–15 days; CO2, CO2 concentration in mixed CO2/air gas 1–5% (v/v).
Figure 4A–C shows the effect of inoculum ratio (bacteria to microalgae) on lipid productivity with change in the remaining parameters, respectively (CO2, light intensity, and harvest time). When light intensity or harvest time were low (Fig. 4A,B), the lipid productivity was very low and no change was observed when inoculum ratio (bacteria to microalgae) was increased from minimum to maximum. When light intensity or harvest time enhanced gradually to optimal conditions, the increase of inoculum ratio started to show impact on lipid productivity and the maximum yield was achieved when inoculum ratio was 100%. This indicates that when other conditions are suitable for microalgal growth, the enhancement of bacteria to microalgae ratio can increase the lipid productivity. Interestingly, the lipid productivity with respect to the interaction of carbon dioxide and inoculum ratio (Fig. 4C) showed that increasing inoculum ratio could only enhance lipid yield when CO2 concentration was less than 3%. When CO2 concentration was above 3%, no significant impact was observed with the change of inoculum ratio. Figures 4A,D,F show the impact of light intensity along with the change of the other three factors. Generally, the lipid productivity increased along with the enhanced light intensity until the optimal condition was reached (235.4 µmol/m2/s) and then declined with further increase of light intensity. The impact of light intensity on lipid productivity tended to be more significant at high inoculum ratio (> 80%) (Fig. 4A), low CO2 concentration (< 3%) (Fig. 4D) and exponential/stationary growth stages (Fig. 4F). Similar to the biomass yield, harvest time had significant impact on lipid productivity that reached to maximum productivity at the stationary stage (10.4 days) and then declined. Interestingly, harvest time and CO2 concentration had significant interactive impact on the lipid productivity (p = 0.023) (Fig. 4E). At low CO2 concentration (< 3%), the lipid accumulation increased with extended harvest time until optimal time, but decreased with the same extended harvest time when CO2 continued to increase above 3%.
The lipid content in microalgal cells at different cultivation conditions was also examined by analyzing the lipid fluorescence intensity of the flow cytometry histogram. The greater the lipid fluorescence intensity, the higher lipid content was. Similar to the analysis of microalgal cell size, we compared the impact of inoculum ratio, CO2, and light intensity respectively on microalgal lipid content by keeping the other three cultivation conditions the same. With other conditions held constant, increasing the bacteria inoculum clearly stimulated lipid accumulation in microalgal cells (Fig. 5C,D). When the ratio of bacteria to microalgae increased from 43.74 to 81.25%, the average lipid fluorescence intensity of lipid enhanced 14 times and shifted from 9.4 × 10³ (43.74% inoculum ratio of bacteria to microalgae) to 1.3 × 10⁵ (81.25% inoculum ratio of bacteria to microalgae). Light intensity also significantly enhanced microalgal lipid content (Fig. 5B,D). The average lipid fluorescence intensity increased 10 times when the light intensity enhanced, being 1.4 × 10⁴ at 112.5 µmol/m2/s and 1.3 × 10⁵ at 237.5 µmol/m2/s. Compared to inoculation ratio and light intensity, CO2 supply had much less impact on the lipid content (Fig. 5A,D), with an average lipid fluorescence intensity of 3.3 × 10⁵ at 2% of CO2 supply and 1.3 × 10⁵ at 4% of CO2 supply.
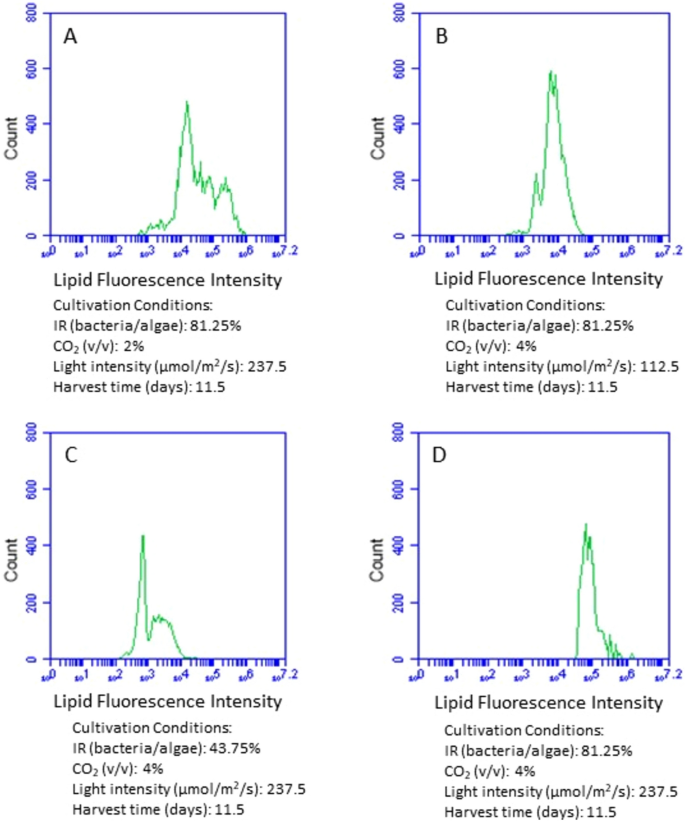
Comparison of fluorescence intensity of the flow cytometry histogram showing lipid accumulation in microalgal cells at different cultivation conditions. IR (inoculum ratio), inoculation ratio of bacteria to microalgae.
Simultaneous optimization of microalgal biomass and lipid productivity
The optimum conditions of both biomass and lipid yield were 100% of inoculum ratio (bacteria/microalgae), 3.6% of CO2, 205.8 µmol/m2/s of light intensity, and 10.6 days of harvest time. The maximum outputs of biomass and lipid production were 1.7 × 10⁷ cells/mL and 3.7 × 10¹² Total FL/mL, corresponding to 1.10 mg/mL of dry biomass and 0.21 mg/mL of total lipid respectively (SI Fig. S3—algal biomass and lipid productivity analyses). While comparing the optimum conditions required for biomass and lipid productivity individually and simultaneously, there was no significant difference with harvest time and inoculum ratio (bacteria/microalgae). The optimal harvest time stayed very close between 10 and 11 days. Similarly, the maximum inoculum ratio (100%) produced the best output in all cases. For light intensity, the maximum biomass was obtained at 204 µmol/m2/s while maximum lipid productivity was achieved at 235 µmol/m2/s. The optimum condition required for both microalgal biomass and lipid productivity was close to the optimum condition for biomass yield. With regards to CO2 supply, there was a difference between optimal concentrations required for biomass (4.1% CO2) and lipid (2.8% CO2). To achieve maximum yields of both the biomass and lipid, CO2 concentration was in the middle of two individual optimum conditions.


