BaKO mice harbor dysfunctional adipocytes, which promote tumor progression in breast and colon cancer models
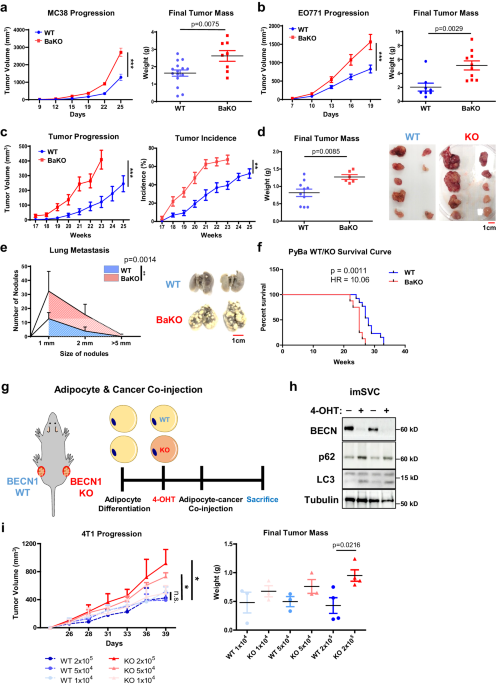
To explore the impact of dysfunctional adipocytes in the TME, we employed BaKO mice to assess the progression of five syngeneic tumor models from various tissue origin. We found that colorectal (MC-38) and breast cancer (EO771) cells showed accelerated growth in BaKO mice (Fig. 1a, b; Supplementary Fig. 1a, b), while the melanoma and lung cancer cells did not (Supplementary Fig. 1câe). Next, we utilized the mammary tumor virus polyoma middle T antigen (MMTV-PyMT) transgenic mouse model that spontaneously develops breast cancer21. Here, we generated adipocyte-specific Becn1 KO conditions during breast cancer development by crossing MMTV-PyMT mice with BaKO mice (PyBaKO). PyBaKO mice exhibited an increased tumor incidence and progression (Fig. 1c, d), resulting in higher lung metastasis and mortality rates (Fig. 1e, f).
a Tumor volumes and weights after subcutaneous injection of MC-38 into 6- week- old WT and adipocyte specific BECN1 KO (BaKO) mice (WT, nâ=â15; BaKO, nâ=â8). b Tumor volumes (WT, nâ=â18; BaKO, nâ=â12) and weights (WT, nâ=â8; BaKO, nâ=â10) after mammary fat pad injection of EO771 into 6-week-old WT and BaKO mice. c Average growth kinetics and incidence of breast tumors generated from 10 mammary glands of MMTV-PyMT BECN1 WT mice (PyWT, nâ=â16) and MMTV-PyMT BECN1 KO mice (PyBaKO, nâ=â16). d Average tumor mass isolated from each mammary gland and a representative image of the tumors from PyWT (nâ=â10) and PyBaKO (nâ=â6) mice. Mice were sacrificed at 23 weeks of age. e Metastasized tumor nodules counted from the lungs of PyWT (nâ=â13) and PyBaKO (nâ=â8) mice at 23 weeks of age. Representative image was taken from mice sacrificed at 23 weeks of age. f KaplanâMeier plot of survival curve of PyWT and PyBaKO mice. Log-rank test p-value (p) and hazard ratio (HR) between PyWT (nâ=â13) and PyBaKO (nâ=â8) mice are indicated. g Schematic timeline of adipocyte-cancer co-injection. (4-OHT: 4-hydroxytamoxifen). h Western blotting analysis of protein lysates isolated from immortalized stromal vascular cells (imSVCs) before being mixed with cancer cells. i Tumor volumes and weights after subcutaneous injection of 4T1 cells mixed with WT or Becn1 KO adipocytes. Mice were sacrificed on the 39th day following co-injection (nâ=â3,4). Statistics were calculated using two-tailed unpaired Studentâs t-test (a, b, d, i), ordinary two-way ANOVA (a, b, c, e, i), and KaplanâMeier survival curve analysis (f). Data are shown as meanâ\(\pm \,\)SEM; *p\(\,\le 0.05\), **p\(\,\le 0.01\), ***p\(\,\le 0.001\). Western blot results are representatives of at least three independent experiments.
We previously reported that BaKO mice developed lipodystrophy, liver steatosis, and glucose intolerance20. These metabolic dysregulations are known to promote tumor progression through systemic impacts22,23, which could have contributed to the rapid tumor growth observed in BaKO mice. Therefore, to determine the direct effects of BECN1-deficient adipocytes on cancer growth, we established immortalized stromal vascular cell (imSVC) lines with conditional Becn1 KO system (ROSA-CreERT2). imSVCs were fully differentiated into adipocytes and then treated with 4-hydroxytamoxifen (4-OHT) to deplete BECN1. Next, we co-injected WT or Becn1 KO imSVCs and breast cancer cells (4T1) into the mouse flanks (Fig. 1g, h). Consistently, tumors grew more rapidly as the number of Becn1 KO adipocytes in the mix increased, which was not observed in cancer cells mixed with WT adipocytes (Fig. 1i). These results demonstrate that Becn1 KO adipocytes are sufficient to promote tumor growth without the systemic effects observed in BaKO mice.
BECN1-deficient adipocytes induce pro-inflammatory signals such as TNFα and LCN2, to support tumor growth
To elucidate the functional consequences of BECN1 depletion in adipocytes, we conducted RNA-sequencing analysis (RNA-seq) on BaKO inguinal WAT (iWAT). Primarily, we performed hallmark gene set enrichment analysis (HGSEA) to identify the altered gene sets in BaKO WAT. The adipose tissue in BaKO was accompanied by enrichment of multiple gene expression associated with TNFα signaling and inflammatory response (Fig. 2a; Supplementary Fig. 2a). Further examination revealed activation of TNFα downstream signaling in Becn1 KO adipocytes (Fig. 2b). Additionally, BECN1-deficient adipocytes secreted elevated levels of TNFα into the cultured media, comparable to those seen in normal adipocytes treated with lipopolysaccharide (LPS) (Fig. 2c).
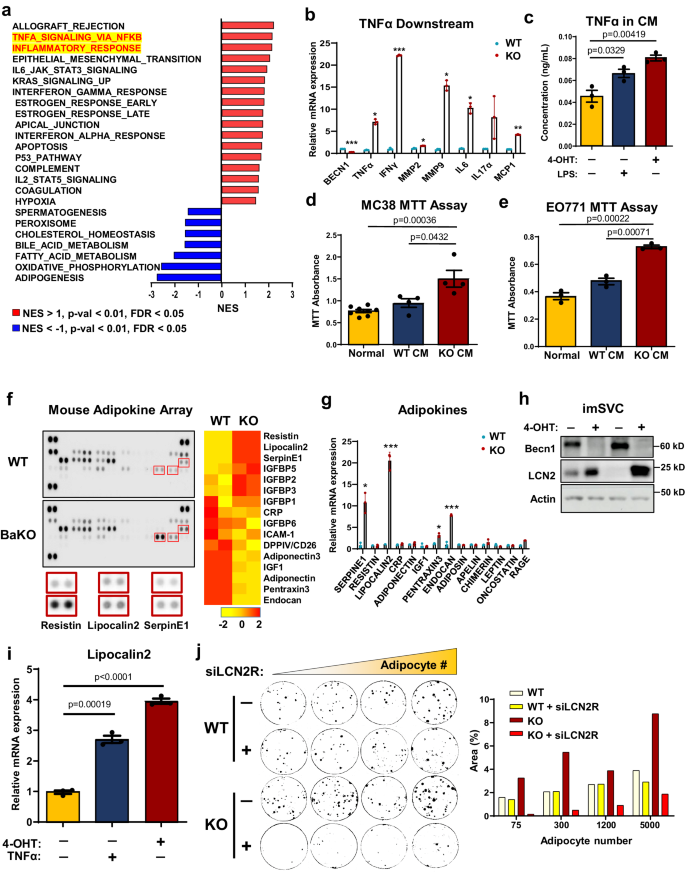
a GSEA plot for RNA-seq result of BaKO iWAT. Significantly altered âHallmark gene setsâ are aligned according to their normalized enrichment score (NES), p-val, and FDR. b Relative mRNA expression of TNFα downstream genes between WT and Becn1 KO imSVCs (nâ=â3, biologically independent samples per group). c Concentration of TNFα in the CM extracted from imSVCs of indicated genotypes using ELISA (nâ=â3, biologically independent samples per group). LPS (100âng/mL) treatment for 24âh. d Cell viability assay performed on MC-38 (Normal nâ=â8; WT CM nâ=â4; KO CM nâ=â4, biologically independent cells per group) and EO771 e grown in normal or conditioned media extracted from WT or BECN1 KO adipocytes for 72âh (nâ=â3, biologically independent cells per group). f Mouse adipokine array performed in dot blot and heatmap analysis representing the altered adipokines. Samples were extracted from WT and BaKO mouse plasma (nâ=â2, each genotype). g Relative mRNA expression of adipokines associated with tumor growth in fully differentiated WT or BECN1 KO imSVCs (nâ=â3, biologically independent samples per group). h Western blot analysis of protein lysates isolated from imSVCs. i Relative mRNA expression of LCN2 in differentiated imSVCs treated with or without TNFα recombinant proteins for 24âh (nâ=â3, biologically independent samples per group). j Colony assay of EO771 co-cultured with WT or BECN1 KO adipocytes. A total of 50 cancer cells were seeded with or without lipocalin2 receptor siRNA (siLCN2R) treatment for 2 days before the co-culture (co-cultured adipocyte numbers are as indicated). Area (%) was quantified using ImageJ. This experiment was conducted once.Statistics were calculated using two-tailed unpaired Students t-test (b, c, d, e, g, i). Data are shown as meanâ\(\pm \,\)SEM; *p\(\,\le 0.05\), **p \(\le 0.01\), ***p\(\,\le 0.001\). Western blot results are representatives of at least three independent experiments.
TNFα, has been shown to impair adipocyte differentiation, adipogenic potential, and fat storage24. Notably, adipocytes co-cultured with cancer cells displayed a marked increase in TNFα signaling (Supplementary Fig. 2b), which can regulate the expression of various adipokines. Therefore, we tested whether secretory factors produced by BECN1-deficient adipocytes are sufficient to promote cancer cell growth. Treatment with concentrated conditioned media (CM) extracted from BECN1-deficient adipocytes led to accelerated growth of both MC-38 and EO771 compared to that with CM derived from WT adipocytes (Fig. 2d, e).
Adipokines are signaling molecules secreted by adipocytes that play critical roles in regulating cellular processes, such as cell proliferation, angiogenesis, and inflammation, all of which are essential in tumor growth and metastasis2,25,26. To further investigate adipokine secretion and its potential role in tumor growth, we measured the levels of 38 adipokines in BaKO plasma using a mouse adipokine array kit (Fig. 2f). We then quantified the expression of each adipokine and aligned them in the order of significance and found that BaKO plasma contained higher levels of oncogenic cytokines, such as SerpinE1, Resistin, Lipocalin2 (LCN2), and insulin-like growth factor binding proteins (IGFBPs) (Fig. 2f). Since these adipokines could be secreted from multiple organs systemically, we inspected their expression in WT and BECN1-deficient adipocytes. Among multiple adipokines, LCN2 was consistently upregulated in BECN1-deficient adipocytes (Fig. 2g, h). Subsequently, we confirmed that adipocyte-LCN2 could be amplified with recombinant TNFα27, suggesting that constitutively active TNFα signaling in BaKO iWAT could be responsible for LCN2 secretion (Fig. 2i; Supplementary Fig. 2c).
LCN2 has been implicated in the development of metabolic disorders28, and its levels are upregulated in the adipose tissue of obese individuals with low-grade inflammation29. To this end, LCN2 is recognized as a pro-inflammatory signal that promotes cancer cell survival and malignancy30. In line with these studies, treatment of recombinant LCN2-protein successfully increased the proliferation of MC-38 and EO771 cells in a dose-dependent manner (Supplementary Fig. 2d, e). Next, we assessed the impact of LCN2 uptake from cancer cells co-cultured with BECN1-deficient adipocytes. EO771 cells co-cultured with BECN1-deficient adipocytes exhibited an elevated level of LCN2 receptor (LCN2R) (Supplementary Fig. 2f). Knock-down of the LCN2R in cancer cells was sufficient to attenuate the effect of Becn1 KO adipocytes on cancer growth in-vitro (Fig. 2j). These results highlight that BECN1 depletion induces secretion of inflammatory and oncogenic adipokines, especially TNFα and LCN2, contributing to the establishment of a pro-tumorigenic niche.
CAAs and BECN1-deficient adipocytes share dedifferentiated phenotypes along with activated YAP/TAZ signaling
CAAs are known to acquire fibroblast-like phenotypes while losing their mature adipocyte properties2,31,32,33. When influenced by adjacent tumor cells, CAAs undergo a dynamic transformation to support cancer cell growth (Fig. 3a). Indeed, co-culturing adipocytes with breast cancer cells resulted in remarkably low expression of adipogenic markers and BECN1 (Fig. 3b, c). Similar to BECN1 deficient adipocytes, co-cultured adipocytes expressed higher levels of Lcn2 (Supplementary Fig. 3a). Therefore, we performed a colony formation assay to assess the impact of adipocytes on cancer cell growth. Our result demonstrates that the growth rate of cancer cells increases proportionally with the number of co-cultured adipocytes (Fig. 3d).
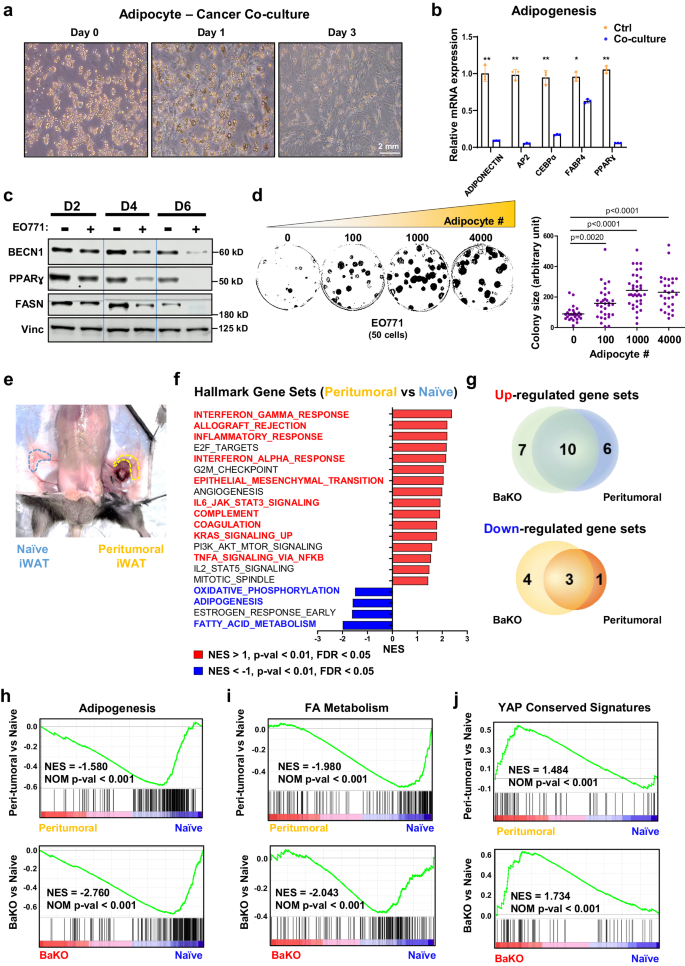
a Differential interference contrast microscopy image of adipocytes co-cultured with EO771 for the indicated duration. b Relative mRNA expression of adipogenic genes from differentiated 10T1/2 adipocytes co-cultured with EO771 breast cancer cells for 4 days (nâ=â3, biologically independent samples per group). c Western blotting analysis of protein lysates isolated from differentiated 10T1/2 adipocytes co-cultured with EO771 breast cancer cells over the time course. d Colony assay of 50 EO771 cells co-cultured with the indicated number of adipocytes. Each colony size was measured using imageJ (50 distinct colonies per group). This experiment was conducted once. e Image of naive and peri-tumoral iWAT samples resected from a mouse. f GSEA result of BaKO and naive adipose tissue ranked by NES. Gene sets that also appear to be differentially expressed in peritumoral WAT are colored in red and blue. g Venn diagram of GSEA results on BaKO and peritumoral WATs compared to naive adipose tissue; p\(\, < 0.01\), FDRâ<â0.05, NESâ<ââ1 or NESâ>â1 (h) GSEA plots for adipogenesis, (i) FA metabolism, and (j) YAP conserved signaling gene sets compared between naive, peritumoral, and BaKO WAT. Statistics were calculated using two-tailed unpaired students t-test (b, d). Data are shown as meanâ\(\pm \,\)SEM; *p \(\le 0.05\), **p\(\,\le 0.01\), ***p\(\,\le 0.001\). Western blot results are representatives of at least three independent experiments.
Next, we sought to characterize the CAAs and BECN1-deficient adipocytes in-vivo. We performed RNA-seq to understand the physiological alterations that WATs undergo upon interaction with cancer cells. We isolated the peritumoral region where adipose tissue surrounds the tumor mass and performed HGSEA with naive WAT (Fig. 3e, f). RNA-seq results from naive, peritumoral, and BaKO WATs further highlighted the resemblance between BECN1-deficient adipocytes and CAAs. HGSEA identified that among the 23 upregulated and 8 downregulated gene sets in peritumoral and BaKO WATs, they shared 10 and 3 gene sets to be up- and down-regulated when compared to naive WAT, respectively (Fig. 3g).
Zhu et al. observed that adipocytes located near cancer cells undergo dedifferentiation under restrictive metabolic conditions, contributing to the generation of a tumor-supportive microenvironment through adipocyte mesenchymal transition (AMT)34. Our HGSEA results revealed that epithelial-mesenchymal transition (EMT) was one of the commonly upregulated gene sets in both BaKO and peritumoral WATs (Supplementary Fig. 3b). In concordance, the genes associated with adipogenesis and fatty acid (FA) metabolism were consistently downregulated, supporting the concept of mesenchymal transition of adipocytes (Fig. 3h, i)32,34.
In addition to EMT, we found YAP signatures to be also commonly upregulated in both BaKO and peritumoral WATs (Fig. 3j). GSEA on âC6: oncogenic signature gene setsâ revealed that YAP signaling was a prominently upregulated gene set in BaKO (Supplementary Fig. 3c, d). In fact, YAP/TAZ levels were significantly elevated in BaKO iWAT (Supplementary Fig. 3e), and YAP/TAZ activity was enhanced in both co-cultured and BECN1-deficient adipocytes (Supplementary Fig. 3f, g). Further characterization of BECN1-deficient adipocytes revealed suppression of adipogenic potential and loss of lipid contents due to a marked increase in lipolysis (Supplementary Fig. 3hâj). These characteristics of BECN1-deficient adipocytes are considered vital features of CAAs (Fig. 3aâc)7,8. Taken together, the acquisition of the shared phenotypes with CAA enables BECN1-deficient adipocytes to form a favorable milieu for tumor growth.
Autophagy is dispensable for BECN1-mediated YAP/TAZ activation
We previously showed that the loss of adipocyte-BECN1 resulted in autophagy inhibition20. Autophagy in adipocytes plays a crucial role not only in maintaining cellular homeostasis but also in facilitating mitochondrial clearance35. To determine whether the autophagy-related function of BECN1 drives adipocyte transformation, we tested the effects of autophagy inhibitors, bafilomycin A and hydroxychloroquine (HCQ), on adipocytes. Although autophagy flux was clearly blocked in mature adipocytes, we could not observe any notable changes in YAP/TAZ expression or its downstream signaling (Fig. 4a; Supplementary Fig. 4aâc).
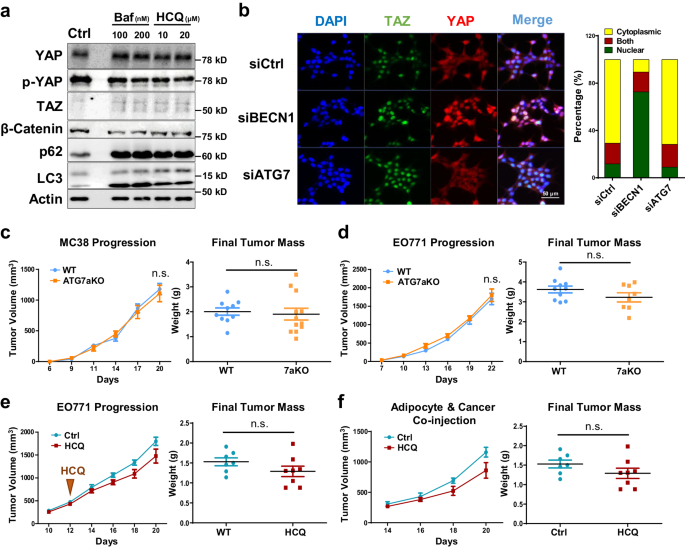
a Western blot analysis of protein lysates isolated from differentiated 3T3L1 treated with autophagy inhibitors, Bafilomycin A (Baf) and Hydroxychloroquine (HCQ), for 48âh. b Representative IF image of HEK293T cells stained with YAP, TAZ, and DAPI after siRNA BECN1 and siATG7 transfection. Localization of YAP/TAZ was quantified using ImageJ. Refer to Supplementary Fig. 4d for the Western blot analysis. c Tumor volumes and weights measured after subcutaneous injection of MC-38 into 7-week-old WT and ATG7aKO (WT, nâ=â10; ATG7aKO, nâ=â12). d Tumor volumes and weights measured after mammary fat pad injection of EO771 into 7-week-old WT and ATG7aKO (WT, nâ=â10; ATG7aKO, nâ=â8). e Tumor volumes and weights measured after mammary fat pad injection of EO771 into 7-week-old mice treated with and without HCQ (50âmg/kg, injected everyday) (NT, nâ=â7; HCQ, nâ=â8). f Tumor volumes and weights measured after co-injection of EO771 and adipocytes. Adipocytes were pretreated with PBS or HCQ (40âμM) for 2 days. 2.5 à 105 number of cancer cells and adipocytes were mixed to be subcutaneously injected into 7-week-old mice (Ctrl nâ=â7; HCQ nâ=â8). Statistics were calculated using ordinary two-way ANOVA (c, d) and two-tailed unpaired Students t-test (c, d, e, f). Western blot results are representatives of at least three independent experiments.
Autophagy-related gene 7 (ATG7) is another key molecule involved in autophagy flux, particularly in autophagosome elongation and closure36. While BECN1 deletion in HEK293 induced nuclear translocation of YAP/TAZ, ATG7 deletion alone could not replicate this effect (Fig. 4b; Supplementary Fig. 4d). Furthermore, we employed adipocyte-specific Atg7 KO mice (ATG7aKO) to assess the tumor progression of MC-38 and EO771. Unlike BECN1, Atg7 deletion in mouse adipocytes was insufficient to provide a pro-tumorigenic environment for MC38 and EO771 (Fig. 4c, d; Supplementary Fig. 4e, f). Consistently, co-culture of HCQ-treated adipocytes and cancer cells could not enhance the growth of EO771 (Supplementary Fig. 4g). Moreover, when mice were treated with HCQ or co-injected with HCQ-treated adipocytes, there was no significant difference in EO771 progression compared to the control groups (Fig. 4e, f). These studies highlight the unique roles of adipocyte-BECN1 in regulating cellular homeostasis beyond autophagy. Collectively, the alteration of YAP/TAZ expression and adipocyte transformation observed in BaKO should be attributed to the autophagy-independent function of BECN1.
Dynamic YAP/TAZ regulation modulates adipocyte differentiation status
Because adipocyte differentiation involves a dynamic alteration of multiple gene expression, we assessed how the BECN1, YAP1, and TAZ levels change throughout the process. We observed that the BECN1 level increases as adipocyte differentiation progresses. In contrast, signaling molecules for cellular plasticity and proliferation, such as YAP/TAZ and β-catenin, were decreased in mature adipocytes (Fig. 5a, b). As we further explored the role of YAP/TAZ in adipocyte maturation, our immunofluorescence (IF) analysis showed that the adipocytes expressing high PLIN1 levels have low nuclear YAP/TAZ levels, whereas PLIN1-negative preadipocytes contain higher levels of nuclear YAP/TAZ (Supplementary Fig. 5a).
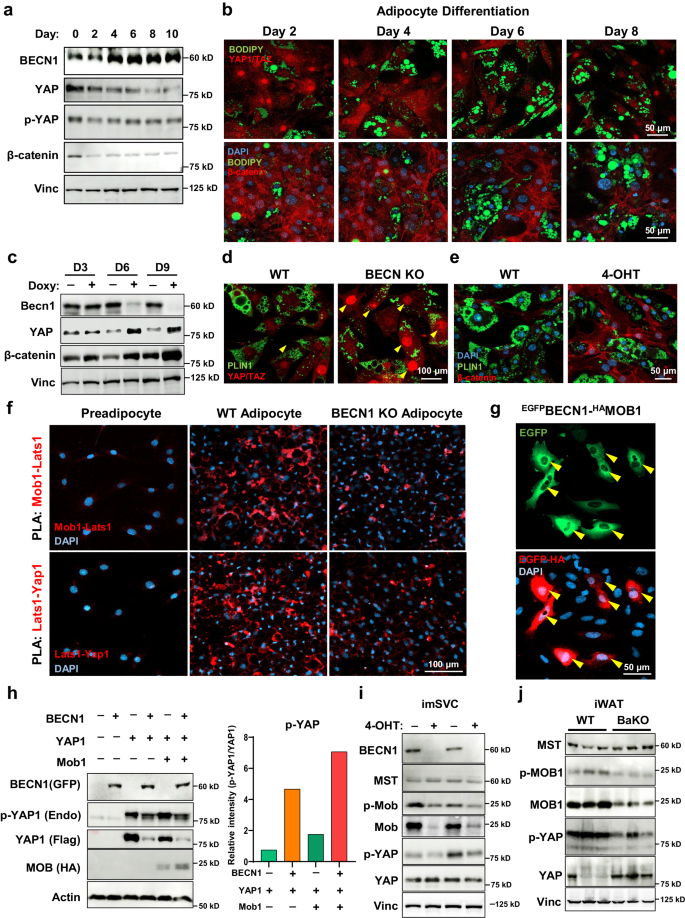
a Western blotting analysis of protein lysates isolated from differentiating adipocytes over the time course. b Representative IF images throughout 10T1/2 adipocyte differentiation. Image was taken from 2nd day to 8th day of differentiation. Adipocytes were stained with YAP/TAZ (red, upper panel) and β-catenin (red, lower panel), BODIPY (green), and DAPI (blue). c Western blotting analysis of protein lysates isolated from doxycycline-inducible Becn1 KO cell lines. Fully differentiated adipocytes with and without doxycycline (Doxy) treatment for the time indicated. d, e Representative IF images of mature adipocytes stained with YAP/TAZ and (e) β-catenin. Arrowheads indicate nuclear YAP/TAZ. f Representative IF images of PLA conducted on preadipocytes, adipocytes, and BECN1 KO adipocytes. Interaction between endogenous MOB1-LATS1 and LATS1-YAP1 were detected. g Representative IF image of PLA conducted on U2OS cells overexpressed with BECN1GFP and MOB1HA. h Western blotting analysis of protein lysates isolated from HEK293 cells overexpressed with BECN1GFP, YAP1FLAG, and MOB1HA as indicated. The tag-antibodies were used to detect BECN1, YAP1, and MOB1. Endogenous p-YAP levels relative to YAP1 were quantified using imageJ. i Western blotting analysis of protein lysates isolated from imSVCs with and without 4-OHT treatment. j Western blotting analysis of protein lysates isolated from WT and BaKO inguinal white adipose tissues (iWATs). Mice were sacrificed at 8-weeks-old of age. Western blot results are representatives of at least three independent experiments.
To understand the physiological response of YAP/TAZ under BECN1 depletion, we established doxycycline-inducible Becn1 KO adipocytes. We found that YAP and β-catenin levels were inversely correlated with BECN1 levels (Fig. 5c). IF imaging also revealed the enhanced levels of YAP/TAZ and β-catenin in Becn1 KO adipocytes (Fig. 5d, e; Supplementary Fig. 5bâd). Consistently, BECN1 depletion in imSVCs enhanced nuclear translocation of YAP/TAZ (Supplementary Fig. 5e). Next, we investigated whether CAAs also expressed altered YAP/TAZ and β-catenin levels. In line with BECN1-deficient adipocytes, cancer cell-co-cultured adipocytes exhibited elevated YAP/TAZ nuclear translocation and β-catenin levels (Supplementary Fig. 5f).
BECN1 regulates the Hippo pathway through interaction with MOB1
Some studies have introduced the reciprocal interaction between two tightly regulated biological processes: the Hippo pathway and autophagy37. To elucidate the underlying mechanism of how BECN1 deficiency leads to the activation of YAP/TAZ signaling, we performed a proximity ligation assay (PLA) and examined the interactions between BECN1 and proteins involved in the Hippo signaling pathway.
Upon adipocyte differentiation, interactions between Hippo-associated proteins, such as MOB1-LATS1 and LATS1-YAP1 were enhanced, indicating the activation of Hippo pathway to control YAP/TAZ levels (Fig. 5f). However, these interactions were significantly diminished by BECN1 depletion (Fig. 5f, Supplementary Fig. 6a). Subsequently, overexpression of BECN1 along with the Hippo-associated proteins, such as YAP1, LATS1, MST1, and MOB1 demonstrated a remarkably strong interaction of BECN1-MOB1 compared to other Hippo-associated proteins (Main Fig. 5g, Supplementary Fig. 6b, c), and the interaction was stronger than that between LATS1 and MOB1 (Supplementary Fig. 6d). To investigate the functional implication of BECN1 on MOB1, we assessed the changes in MOB1 and p-MOB1 levels upon BECN1 overexpression. The results showed increased MOB1 level, enhancing the phosphorylation of YAP (Fig. 5h). Conversely, with BECN1 depletion from adipocytes, MOB1 levels diminished in both imSVCs and BaKO iWAT (Fig. 5i, j). These findings uncover the mechanistic insights into the contribution of BECN1 to the Hippo pathway.
Lipodystrophy phenotypes in BaKO were restored by additional deletion of YAP/TAZ
To eliminate YAP/TAZ-mediated adipocyte transformation, we crossed BaKO with Yap/Taz-floxed mice and generated adipocyte-specific Becn1/Yap1/Taz triple-KO mice (BYTaKO) (Fig. 6a; Supplementary Fig. 7a). These mice developed adipocytes with impaired autophagy (Supplementary Fig. 7b); however, lipodystrophy phenotypes observed in BaKO were restored in BYTaKO (Fig. 6bâg). This process involved the restoration of adipose tissue mass, potentially leading to the alleviation of liver steatosis through successful lipid storage in the adipose tissue (Fig. 6bâd; Supplementary Fig. 7c). While lipodystrophy observed in BaKO was prevented in BYTaKO, single Yap1 or Taz deletion was insufficient to restore the BaKO phenotypes (Supplementary Fig. 7d). Accordingly, transcriptomic analyses revealed that enhanced TNFα signaling observed in BaKO was curtailed in BYTaKO iWAT (Fig. 6e, f). Plasma TNFα concentration was also reduced by the additional deletion of Yap/Taz (Fig. 6g), implying alleviated systemic inflammation in BYTaKO. Additionally, BYTaKO mice were resistant to HFD-induced obesity (Supplementary Fig. 7e, f).
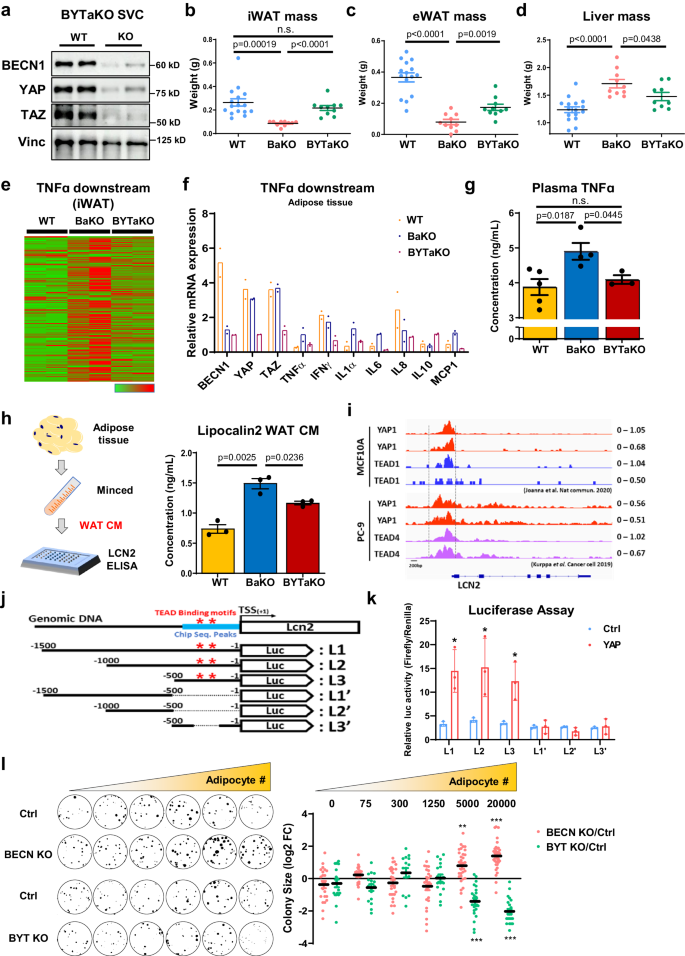
a Western blot analysis of protein lysates isolated from fully differentiated WT and adipocyte specific BECN1/YAP/TAZ KO (BYTaKO) SVCs. bâd Organ weights measured from 8-week-old WT, BaKO, and BYTaKO (WT, nâ=â16; BaKO, nâ=â10; BYTaKO, nâ=â10). e Heatmap analysis of TNFα downstream gene expression obtained from WT, BaKO, and BYTaKO iWAT. f Relative mRNA expression of BECN1, YAP, TAZ, and TNFα downstream genes confirmed by RT-qPCR (nâ=â2 mice per genotype). g Concentration of TNFα in WT, BaKO, BYTaKO mouse serum using ELISA (WT, nâ=â5; BaKO, nâ=â4; BYTaKO, nâ=â3). h Concentration of LCN2 in WT, BaKO, BYTaKO iWAT CM using ELISA. iWATs were resected and minced to obtain WAT CM (nâ=â3 mice per genotype). i Publicly available YAP1, TEAD1, and TEAD4 CHIP-seq reads around LCN2 gene loci. CHIP-seq was conducted in MCF10A and PC-9 cells. j Schematic representation of luciferase reporter construct containing LCN2 promoter region. Red stars indicate the TEAD binding motifs, and blue bar indicates the regions with high CHIP-seq reads. k Dual Luciferase assay conducted in HEK293 cells transfected with the luciferase reporter constructs (LCN2). After transfection, recombinant YAP1 protein was treated (1âμg, 48âh) (nâ=â3, biologically independent samples per group). l Colony assay of EO771 co-cultured with BECN1 or BECN1/YAP/TAZ KO adipocytes. A total of 30 cancer cells were seeded with differentiated adipocytes, with adipocyte numbers indicated. Sizes for each EO771 colony were quantified using ImageJ and presented relative to the control, expressed as log2-fold change (FC) (30 distinct colonies per group). This experiment was conducted once. Statistics were calculated using two-tailed unpaired Students t-test (b, c, d, g, h, l). Data are shown as meanâ\(\pm \,\)SEM; *p\(\,\le 0.05\), **p\(\,\le 0.01\), ***p\(\,\le 0.001\). Western blot results are representatives of at least three independent experiments.
Next, we investigated whether additional YAP/TAZ deletion regulates LCN2 in adipocytes. The measurement of LCN2 levels revealed that BYTaKO WAT CM contained less LCN2 than that of BaKO (Fig. 6h). Consistently, LCN2 mRNA expression was diminished in BYTaKO iWAT compared to that in BaKO (Supplementary Fig. 8a). To identify how YAP/TAZ deletion suppresses LCN2 expression, we analyzed the Chromatin Immunoprecipitation Sequencing (CHIP-seq) data of YAP and TEAD available from a public database. The results showed robust peaks at the LCN2 promoter region, while no significant peaks were detected for TNFα (Fig. 6i; Supplementary Fig. 8b). Subsequently, we performed luciferase assay to validate direct regulation of LCN2 and TNFα at the transcriptional level through YAP. Indeed, adding recombinant YAP protein remarkably increased the luciferase activity of LCN2 promoter containing TEAD binding motifs (Fig. 6j, k; Supplementary Fig. 8c, d).
To evaluate whether BECN1/YAP/TAZ (BYT)-deficient adipocytes could impact tumor growth, we generated doxycycline-inducible BYT KO adipocytes and performed a colony formation assay. When grown with BECN1-deficient adipocytes, cancer cells exhibited an enhanced proliferation rate in a dose-dependent manner (Fig. 6l). Conversely, BYT-deficient adipocytes interacted with cancer cells to suppress their growth. Together, these findings suggest that additional Yap/Taz deletion prevented adipocytes from providing excessive pro-inflammatory factors and LCN2.
Inhibition of YAP/TAZ activity suppresses the pro-tumorigenic effect of BECN1-deficient adipocytes and HFD feeding
To validate the effect of BYT-deficient adipocytes in vivo, we transplanted MC-38 and EO771 into WT, BaKO, and BYTaKO. Consistent with transcriptomic analysis and colony formation assay, tumor growth was significantly suppressed in BYTaKO compared to that in BaKO (Fig. 7a, b; Supplementary Fig. 9a, b). We next explored the relevance between each mouse genotype, including the peritumoral WATs. To gain a preliminary understanding of the gene expression patterns in WATs, we performed principal component analysis (PCA) on RNA-seq results of naive and peritumoral WATs (WT, BaKO, and BYTaKO). A significant difference was observed between BaKO and WT naive WATs, whereas the BYTaKO WAT exhibited a milder phenotype. This difference was even more pronounced in peritumoral WATs, suggesting that BYTaKO WAT underwent a milder transformation upon cancer transplantation (Supplementary Fig. 9c). As reported previously, the transformation of adipocytes near cancer cells is associated with the downregulation of mature adipocyte markers4,32,38 (Fig. 3b, h). Accordingly, the expression of adipogenesis- and FA metabolism-associated gene sets indicated that the adipocytes in peritumoral WAT of all genotypes had lost adipogenic potential and mature adipocyte properties (Fig. 7c). We observed that BaKO WATs exhibited significantly lower levels of adipogenesis- and FA metabolism-associated genes, whereas BYTaKO WATs retained relatively higher levels of these genes (Fig. 7c).
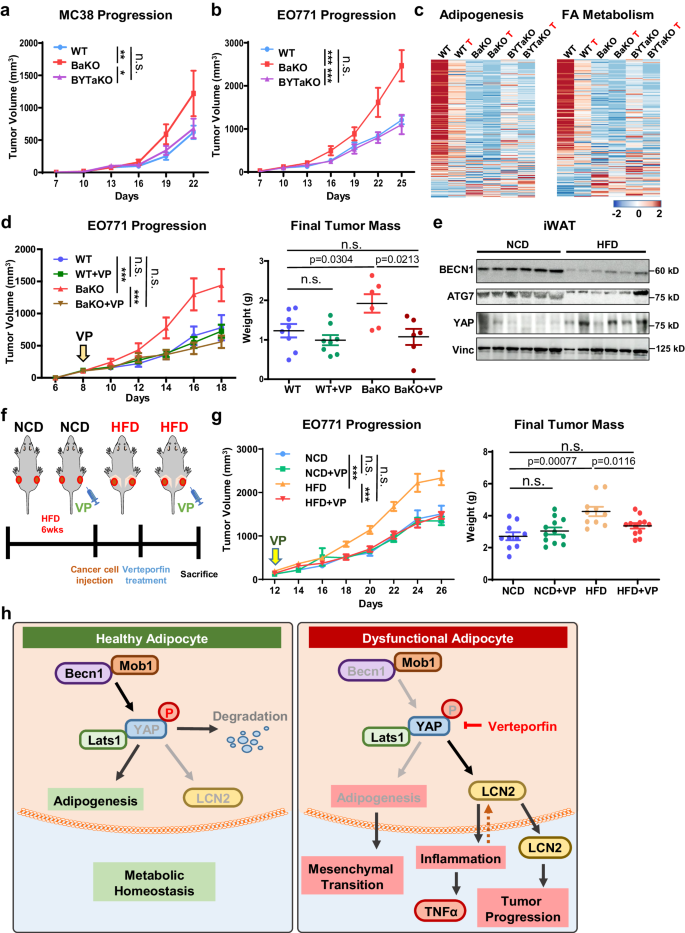
a Tumor volumes measured after MC-38 subcutaneously injected into 7-week-old WT, BaKO, and BYTaKO mice (WT nâ=â20; BaKO nâ=â12; BYTaKO nâ=â12). b Tumor volumes measured after EO771 subcutaneously injected into 7-week-old WT, BaKO, and BYTaKO (WT nâ=â16; BaKO nâ=â6; BYTaKO nâ=â8). c Heatmap analysis of adipogenesis and FA metabolism gene sets between WT, BaKO, and BYTaKO iWATs and their peritumoral WATs (labeled with red letter âTâ) (nâ=â2 each). d Tumor volumes and weights after mammary fat pad injection of EO771 into 7- week-old mice treated with or without VP (30âmg/kg, injected every other day). VP treatment was initiated when tumors reached a volume of 150 mm3, and the mice were sacrificed on day 22 following injection (WT, nâ=â8; WT VP, nâ=â8; KO, nâ=â6; KO VP, nâ=â6). e Western blot analysis of protein lysates isolated from iWAT of Normal Chow Diet (NCD) and High Fat Diet (HFD)-fed mice. Mice were fed with HFD chow for 12 weeks. f Schematic timeline of NCD and HFD-fed mice treated with or without VP. g Tumor volumes and weights after mammary fat pad injection of EO771 into NCD or HFD-fed mice. Verteporfin(VP) treatment (30âmg/kg, injected every other day) was initiated when tumors reached a volume of 150 mm3, and the mice were sacrificed on day 26 following the injection (nâ=â12, each group). h Schematic illustration depicting the signaling mechanism identified in this study. Statistics were calculated using ordinary two-way ANOVA (a, b, d, g) and two-tailed unpaired students t-test (d, g). Data are shown as meanâ\(\pm \,\)SEM; *p\(\,\le 0.05\), **p\(\,\le 0.01\), ***p\(\,\le 0.001\). Western blot results are representatives of at least three independent experiments.
Several studies have demonstrated the anti-tumor activity of verteporfin (VP) through suppression of YAP/TAZ signaling39,40. To complement our genetic mouse model (BYTaKO), we employed VP to inhibit YAP/TAZ activity in adipose tissue (Supplementary Fig. 9d, e). To avoid the direct effect of VP on cancer cells, we administered a lower dose of VP that does not affect WT tumor growth (Fig. 7d). Curtailed VP treatment still led to a regression of the tumor in BaKO, highlighting the potential impact of VP on tumors growing in adipose-rich environments (Fig. 7d). As diet-induced obesity mice develop various metabolic disorders involving inflammatory adipose tissue, we examined the relationship between BECN1 and YAP expression in the iWAT of HFD-fed mice. Interestingly, BECN1 levels were decreased while YAP levels were increased in the HFD-fed iWAT (Fig. 7e; Supplementary Fig. 9f). We further characterized HFD-fed iWAT and realized the overlapping properties between BaKO and HFD-fed iWATs (Supplementary Fig. 9g). Therefore, we hypothesized that VP could drive tumor regression in mice with metabolic dysregulation and evaluated the impact of VP treatment in HFD-fed mice. While EO771 grew more rapidly in HFD-fed mice, VP treatment led to tumor regression only in HFD-fed mice (Fig. 7f, g; Supplementary Fig. 9h, i). In summary, these findings show that BECN1 and YAP/TAZ levels serve as the indicators of adipose tissue health and its potential to provide a pro-tumorigenic environment (Fig. 7h). Moreover, our findings advocate the use of YAP/TAZ inhibitors such as VP to prevent CAA transformation in the context of TME.


