


Sex-specific effects of stroke on fibrin clot properties
The study population included 191 ischemic stroke patients, 45.0% were female, and the mean age was 68â±â12 years. Healthy controls included 291 individuals, 59.4% were female, and the mean age was 50â±â17 years. Descriptive statistics of all variables analyzed in the present study are shown in Supplementary Table S2 online.
Analysis of fibrin clot formation and lysis (see Supplementary Fig. S1) showed that the kinetics of these processes were changed and the correlations between the involved variables were attenuated in stroke patients compared to healthy controls (Supplementary Table S2). For example, the correlation between fibrin CLT and Absmax was reduced to 0.29 in stroke patients from 0.55 in healthy individuals (Supplementary Table S2). This reduction can be traced to different effects of stroke on CLT and Absmax in men and women. Specifically, fibrin CLT and Absmax were strongly correlated in female stroke patients (R2â=â0.187, Pâ=â0.000; Fig. 1A). In contrast, in male stroke patients, there was no correlation between CLT and Absmax (R2â=â0.006, Pâ=âns; Fig. 1B). However, CLT and Absmax were strongly correlated both in healthy females (R2â=â0.236, Pâ=â0.000; Fig. 1C) and healthy males (R2â=â0.437, Pâ=â0.000; Fig. 1D).
Sex affects relationships between fibrin CLT and Absmax in ischemic stroke patients (A,B) but not in healthy individuals (C,D).
Fibrin CLT was significantly longer in female stroke patients compared to healthy women (510â±â264 vs. 400â±â161 s, Pâ=â0.000). In contrast, fibrin CLT was not significantly changed in male stroke patients compared to healthy males (405â±â177 vs. 377â±â143 s, Pâ=â0.181 (Table 1). Sex significantly affected fibrin CLT in stroke patients (longer in women than in men: 510â±â264 vs. 405â±â177 s, Pâ=â0.001) but not in healthy individuals (401â±â161 vs. 377â±â143 s, Pâ=â0.199) (Table 1).
Fibrin Absmax was significantly elevated both in female (0.124â±â0.074 vs. 0.100â±â0.035 A340, Pâ=â0.000) and male stroke patients (0.122â±â0.056 vs. 0.103â±â0.037 A340, Pâ=â0.003) (Table 1). Sex did not affect Absmax in stroke patients (0.124â±â0.074 A340 in females vs. 0.122â±â0.056 A340 in males, Pâ=â0.844) nor in healthy individuals (0.100â±â0.035 A340 in females vs. 0.103â±â0.037 A340 in males, Pâ=â0. 399) (Table 1).
Sex-specific effects of stroke on levels of sulfur-containing metabolites
Levels of uHTL were significantly reduced in male (but not female, Pâ=â0.729) stroke patients compared to healthy controls (24â±â71 vs. 66â±â77 nM, Pâ=â0.000), while levels of uCys and uCysGly were elevated in female (but not male, Pâ=â0.099 and Pâ=â0.495, respectively) stroke patients (uCys: 265â±â207 vs. 181â±â124 μM, Pâ=â000; uCysGly: 10.2â±â7.2 vs. 8.4â±â5.5 μM, Pâ=â0.024). Levels of uHcy were significantly elevated in stroke patients compared to healthy controls (female: 9.2â±â9.2 vs. 4.8â±â3.7 μM, Pâ=â0.000; male: 11.4â±â10.9 vs. 8.9â±â5.7 μM, Pâ=â0.031). Levels of uGSH were significantly reduced in stroke patients (female: 3.5â±â3.4 vs. 5.0â±â5.5 μM, Pâ=â0.021; male: 3.3â±â3.2 vs. 5.6â±â5.4 μM, Pâ=â0.000) (Table 1).
Female stroke patients (but not male) had significantly elevated pHcy compared to healthy controls (7.5â±â3.6 vs. 5.4â±â1.7 μM, Pâ=â0.000) while pCys was elevated both in female (272â±â63 vs. 222â±â63 μM, Pâ=â0.000) and male (256â±â58 vs. 235â±â74 μM, Pâ=â0.020) stroke patients. Levels of pCysGly (17â±â9 vs. 22â±â13 μM, Pâ=â0.002) and pGSH (3.3â±â1.8 vs. 4.6â±â3.0 μM, Pâ=â0.000) were significantly reduced in male (but not in female, Pâ=â0.551 and Pâ=â0.073, respectively) stroke patients. However, plasma methionine (pMet) was not changed in female (Pâ=â0.608) or male (Pâ=â0.316) stroke patients compared to healthy individuals (Table 1).
Changes in creatinine levels associated with ischemic stroke were also sex specific. For example, urinary creatinine was significantly reduced in male stroke patients compared to healthy males (12.8â±â7.1 vs. 17â±â9 mM, Pâ=â0.000) but was not changed in female stroke patients compared to healthy females (9.8â±â6.9 vs. 10.1â±â6.7 mM, Pâ=â0.682). However, plasma creatinine was significantly elevated in ischemic stroke patients, both female and male (female: 76â±â21 vs. 64â±â9 μM, Pâ=â0.000; male: 94â±â40 vs. 81â±â12 μM, Pâ=â0.001) (Table 1).
Sex-specific effects of age on fibrin clot properties
In healthy females, fibrin CLT (R2â=â0.072, Pâ=â0.001; Fig. 2A) and fibrin Absmax (R2â=â0.149, Pâ=â0.000; Fig. 2B) significantly increased with age. In contrast, age did not affect CLT (R2â=â0.0003, Pâ=âns; Fig. 2C) nor Absmax (R2â=â0.004, Pâ=âns; Fig. 2D) in female stroke patients.
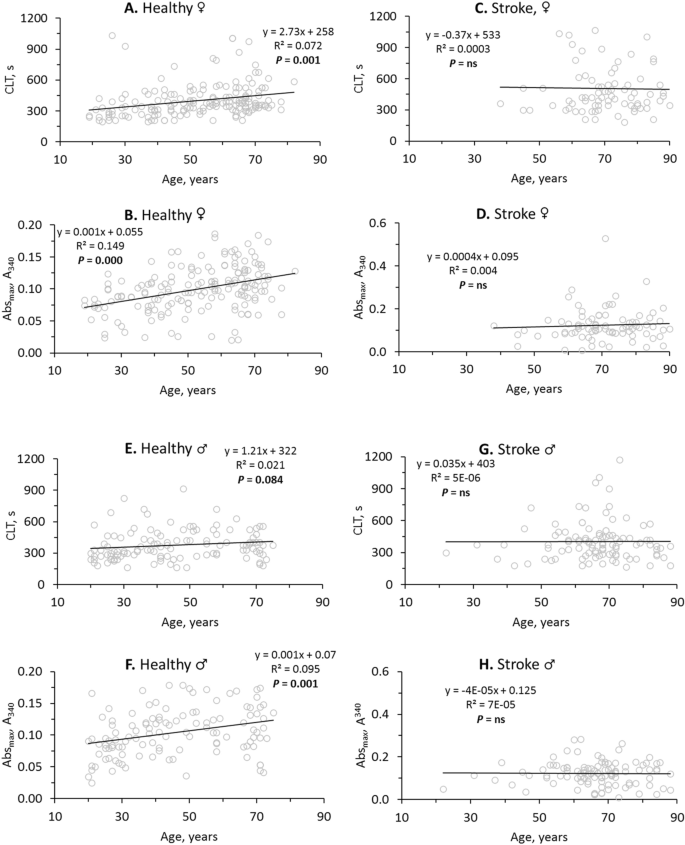
Stroke abrogates the influence of age on fibrin clot properties. Pearsonsâs correlations between fibrin CLT (A,C,E,G), Absmax (B,D,F,H) and age in healthy individuals (A,B,E,F) and ischemic stroke patients (C,D,G,H) are shown. Higher values of CLT and Absmax indicate lower susceptibility to lysis and worse clot structure, respectively.
In contrast to healthy females, CLT was not affected by age in healthy males (R2â=â0.021, Pâ=â0.084; Fig. 2E). However, like in healthy females, significant increases of Absmax with age were seen in healthy males (R2â=â0.095, Pâ=â0.001; Fig. 2F). Like in female stroke patients, age did not affect CLT (R2â=â5Eâ06, Pâ=âns; Fig. 2G) and Absmax (R2â=â7Eâ05, Pâ=âns; Fig. 2H) in male stroke patients.
In healthy females the intercept of the trendline at the CLT axis was 258 s and the CLT was increasing at a rate of 2.73 s/year (Fig. 2A) while in female stroke patients the intercept was elevated to 533 s and there was no significant change in CLT with age (Fig. 2C). This shows that in young female stroke patients CLT has already reached the maximal high value (Fig. 2C), characteristic of CLT in older healthy females (Fig. 2A). Similarly, in young female (Fig. 2D) and male (Fig. 2H) stroke patients Absmax has already reached the maximal high value, characteristic of CLT in older healthy females (Fig. 2B) and males (Fig. 2F). These findings suggest prothrombotic fibrin clot properties in young stroke patients like those of older healthy individuals.
Sulfur-containing amino acid metabolite levels affect fibrin clot properties in healthy individuals but not in ischemic stroke patients
In healthy individuals, urinary sulfur-containing amino acid metabolites were negatively correlated with fibrin CLT and Absmax (Table 2). Specifically, uCys was significantly correlated with CLT (R2â=â0.0215, Pâ=â0.012; Fig. 3A) and Absmax (R2â=â0.021, Pâ=â0.014; Fig. 3B) while uHTL was significantly correlated only with Absmax (R2â=â0.019, Pâ=â0.018; Fig. 3C). Weaker correlations were observed for uHcy with CLT (R2â=â0.013, Pâ=â0.054) and Absmax (R2â=â0.016, Pâ=â0.043), for uCysGly with CLT (R2â=â0.018, Pâ=â0.023) and Absmax (R2â=â0.015, Pâ=â0.038), and for uGSH with Absmax (R2â=â0.013, Pâ=â0.055) (see Supplementary Figure S2).
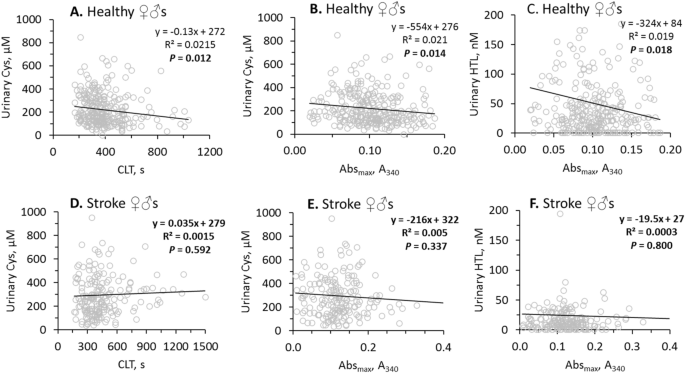
Pearsonsâs correlations between urinary Cys, HTL and fibrin CLT, Absmax are abrogated by stroke. Higher values of CLT and Absmax indicate lower susceptibility to lysis and worse clot structure, respectively.
In contrast, in ischemic stroke patients there were no correlations of uCys with CLT (Fig. 3D) and Absmax (Fig. 3E), and uHTL with Absmax (Fig. 3F). There were also no correlations of uHcy, uCysGly and uGSH with CLT and/or Absmax in ischemic stroke patients (see Supplementary Figure S2). Furthermore, correlations between uHTL and other urinary sulfur-containing amino acid metabolites seen in healthy individuals were also absent in ischemic stroke patients (Table 2). However, correlations between urinary creatinine and other urinary sulfur-containing amino acid metabolites seen in healthy individuals were also seen in ischemic stroke patients (Table 2).
These findings suggest that efficient urinary excretion of sulfur-containing amino acid metabolites in healthy individuals can contribute to favorable clot properties, i.e. structure that is less compact and more susceptible to lysis.
In contrast to urinary sulfur-containing amino acid metabolites, plasma sulfur-containing amino acid metabolites (pHcy, pCys, pCysGly, pMet, and pGSH) were not associated with fibrin CLT nor Absmax in healthy individuals. These plasma metabolites were also not associated with fibrin CLT nor Absmax in ischemic stroke patients (see Supplementary Table S3). These findings suggest that the urinary sulfur-containing amino acid metabolites might be better predictors of ischemic stroke risk than the plasma metabolites.
While urinary creatinine was associated with CLT and Absmax, plasma creatinine was associated with neither (see Supplementary Table S3).
Relationships of sulfur-containing amino acid metabolites with age and GFR in ischemic stroke patients and healthy individuals
Age
In healthy individuals, urinary sulfur-containing amino acid metabolites, uHcy (R2â=â0.101, Pâ=â0.000), uCys (R2â=â0.143, Pâ=â0.000), uCysGly (R2â=â0.118, Pâ=â0.000), and uHTL (R2â=â0.018, Pâ=â0.021) significantly decreased with age while uGSH levels were not affected by age (see Supplementary Figure S3).
In contrast, in ischemic stroke patients age did not significantly affect levels of uCysGly (R2â=â0.030, Pâ=â0.092) and uHTL (R2â=â0.010, Pâ=â0.171). However, uHcy (R2â=â0.013, Pâ=â0.002) and uCys (R2â=â0.045, Pâ=â0.005) remained negatively associated with age in ischemic stroke patients. Like in healthy individuals, levels of uGSH were not affected by age in stroke patients (see Supplementary Figure S3).
In ischemic stroke patients, the influence of age on plasma sulfur-containing amino acid metabolites was also changed in a metabolite specific manner. For example, pHcy (R2â=â0.041, Pâ=â0.004) and pCys (R2â=â0.124, Pâ=â0.000) were positively correlated with age in ischemic stroke patients but not in healthy individuals (see Supplementary Figure S4). While pCysGly (R2â=â0.0487, Pâ=â0.000) and pGSH (R2â=â0.0585, Pâ=â0.000) significantly decreased with age in healthy individuals, these metabolites increased with age in ischemic stroke patients (pCysGly: R2â=â0.016, Pâ=â0.073; pGSH: R2â=â0.040, Pâ=â0.005) (see Supplementary Figure S4).
GFR
Relationships between GFR and urinary sulfur-containing amino acid metabolites were also different in ischemic stroke patients compared to healthy individuals. Specifically, in healthy individuals, GFR was significantly associated with uHcy (R2â=â0.037, Pâ=â0.001), uCys (R2â=â0.055, Pâ=â0.000), and uCysGly (R2â=â0.047, Pâ=â0.000) (see Supplementary Figure S5). In ischemic stroke patients, these associations were attenuated (uHcy: R2â=â0.0099, Pâ=â0.075; uCys: R2â=â0.0114, Pâ=â0.075) or absent (uCysGly: R2â=â0.0002, Pâ=âns) (see Supplementary Figure S5). However, GFR did not significantly influence uHTL and uGSH in healthy controls and ischemic stroke patients (see Supplementary Figure S5; Table 3).
Determinants of fibrin CLT and Absmax in ischemic stroke patients and healthy individuals
Bivariate correlations
In healthy individuals, bivariate correlation analysis showed that fibrin CLT was associated with uCys, uCysGly, and ten other variables: CBS T833C 844ins68 polymotphism (βâ=â0.12, Pâ=â0.035), uCreatinine (βâ=âââ0.18, Pâ=â0.001), total cholesterol (βâ=â0.17, Pâ=â0.003), LDL-cholesterol (βâ=â0.14, Pâ=â0.022), triglycerides (βâ=â0.11, Pâ=â0.062), BMI (βâ=â0.19, Pâ=â0.001), hypertension (βâ=â0.17, Pâ=â0.003), earlier CVD (βâ=â0.12, Pâ=â0.043), age (βâ=â0.23, Pâ=â0.000), and Absmax (βâ=â0.55, Pâ=â0.000) (Table 4).
In ischemic stroke patients, fibrin CLT was associated with a different set of variables that included pGSH (βâ=âââ0.17, Pâ=â0.021), pMet (βâ=âââ0.17, Pâ=â0.021), and five other variables: MTHFR C1298A polymorphism (βâ=â0.15, Pâ=â0.033), glucose (βâ=â0.16, Pâ=â0.031), sex (βâ=âââ0.23, Pâ=â0.001), earlier CVD (βâ=â0.16, Pâ=â0.031), and Absmax (βâ=â0.29, Pâ=â0.000) (Table 4).
Fibrin Absmax was associated with different sets of variables. In healthy individuals, fibrin Absmax was associated with uHTL (βâ=âââ0.14, Pâ=â0.018), uHcy (βâ=âââ0.13, Pâ=â0.043), uCys (βâ=âââ0.14, Pâ=â0.014), uCysGly (βâ=âââ0.12, Pâ=â0.038), and ten other variables: uCreatinine (βâ=âââ0.14, Pâ=â0.014), anti-N-Hcy-protein autoantibody (βâ=â0.13, Pâ=â0.028), total cholesterol (βâ=â0.22, Pâ=â0.000), LDL-cholesterol (βâ=â0.22, Pâ=â0.000), triglycerides (βâ=â0.13, Pâ=â0.024), BMI (βâ=â0.29, Pâ=â0.000), hypertension (βâ=â0.13, Pâ=â0.024), other heart disease (βâ=â0.14, Pâ=â0.019), age (βâ=â0.33, Pâ=â0.000), and fibrin CLT (βâ=â0.55, Pâ=â0.000) (Table 4). In stroke patients, fibrin Absmax was associated with a different set of variables that included pMet (βâ=â0.19, Pâ=â0.009) and three other variables: MTHFR A1298C polymorphism (βâ=â0.21, Pâ=â0.004) and fibrin CLT (βâ=â0.29, Pâ=â0.000) (Table 4).
Multiple regression analysis
In healthy individuals, multiple regression analysis showed that fibrin CLT was positively associated with pGSH (βâ=â0.11, Pâ=â0.019) and four other variables: CBS T833C 844ins68 polymorphism (βâ=â0.13, Pâ=â0.008), earlier CVD (βâ=â0.13, Pâ=â0.009), sex (βâ=âââ0.12, Pâ=â0.018), and fibrin Absmax (βâ=â0.55, Pâ=â0.000); adjusted R2 was 0.34, Pâ=â0.000 (Table 4).
In ischemic stroke patients, fibrin CLT was associated with a different set of variables that included uHTL (βâ=â0.13, Pâ=â0.048), uCysGly (βâ=â0.20, Pâ=â0.003), pCysGly (βâ=âââ0.22, Pâ=â0.001) and four other variables: GFR (βâ=â0.19, Pâ=â0.007), diabetes (βâ=â0.19, Pâ=â0.004), sex (βâ=âââ0.21, Pâ=â0.001), and fibrin Absmax (βâ=â0.35, Pâ=â0.000); adjusted R2 was 0.24, Pâ=â0.000 (Table 4).
In healthy individuals, fibrin Absmax was associated with a different set of variables: uHTL (βâ=âââ0.10, Pâ=â0.025), uGSH (βâ=âââ0.12, Pâ=â0.012), and four other variables: BMI (βâ=â0.13, Pâ=â0.013), age (βâ=â0.19, Pâ=â0.000), sex (βâ=â0.12, Pâ=â0.032), and fibrin CLT (βâ=â0.48, Pâ=â0.000); adjusted R2 was 0.38, Pâ=â0.000 (Table 4).
In stroke patients, fibrin Absmax was associated with a different set of variables that included pCysGly (βâ=â0.17, Pâ=â0.017), pMet (βâ=âââ0.18, Pâ=â0.009), and three other variables: MTHFR A1298C (βâ=â0.18, Pâ=â0.009) and CBS T833C 844ins68 (βâ=â0.13, Pâ=â0.049) polymorphisms, and fibrin CLT (βâ=â0.31, Pâ=â0.000); adjusted R2 was 0.18, Pâ=â0.000 (Table 4).
These findings show that different sets of sulfur-containing amino acid metabolites and other variables contribute to fibrin clot properties in healthy individuals and stroke patients.
Associations of sulfur-containing amino acid metabolites, fibrin CLT and Absmax with ischemic stroke
Bivariate correlations
In bivariate correlation analysis, urinary (uHTL, uHcy, uCys, uGSH) and plasma (pHcy, pCys, pCysGly, pGSH) sulfur-containing amino acid metabolites, but not uCysGly, were significantly associated with ischemic stroke (Table 5) as were fibrin CLT and Absmax. Other variables such as pCreatinine, glucose, lipid measures, GFR, age, sex, and prior CAD, MI, hypertension, diabetes, and other heart diseases were also associated with ischemic stroke (Table 5).
Logistic regression
In logistic regression analysis, adjusting for anti-N-Hcy autoantibodies14, age, and sex, uHTL, uHcy, uCys, uGSH, pCys, and pCysGly remained significantly associated with ischemic stroke while pHcy and pGSH did not (Model 1, Table 5). MTHFR C677T polymorphism that affects the MTHFR enzyme, important for B-vitamin-dependent recycling of Hcy to methionine15, was also associated with ischemic stroke in Model 1 (Table 5), consistent with earlier studies16.
Adjustments for earlier diseases did not affect these associations (Model 2, Table 5). Other adjustments for GFR, glucose, LDL cholesterol, HDL cholesterol, and triglycerides, also did not affect these associations (Model 3, Table 5), except for uHcy which was not significantly associated with stroke in Model 3. The associations of sulfur-containing amino acid metabolites and MTHFR C677T polymorphism with ischemic stroke were independent of other metabolites and traditional stroke risk factors such as lipid measures, GFR, glucose, age, sex, early CAD, MI, hypertension, diabetes, and other heart diseases.
Logistic regression analysis in a model adjusted for anti-N-Hcy autoantibodies14, age, and sex, also showed that fibrin Absmax, but not CLT, was significantly associated with ischemic stroke (Pâ=â0.049, Model 1, Table 5). The association of fibrin Absmax, with stroke became stronger in models adjusted for earlier diseases (Pâ=â0.007, Model 2, Table 5) and for GFR, glucose, LDL cholesterol, HDL cholesterol, and triglycerides (Model 3, Table 5). These findings show that the association of fibrin Absmax with ischemic stroke was independent of sulfur-containing amino acid metabolites and traditional stroke risk factors such as lipid measures, glucose, GFR, age, sex, and earlier CAD, MI, hypertension, diabetes, and other heart diseases (Table 5).
Contribution of individual sulfur-containing amino acid metabolites to the risk of ischemic stroke
To estimate the contribution of individual sulfur-containing amino acid metabolites to the risk of ischemic stroke, we examined effects of each of these metabolites on R2 values in the logistic regression models described in Table 5. We found that uHTL, uHcy, uCys, and uGSH explained individually 1, 0.5, 0.5, and 1.5%, respectively, of the ischemic stroke risk, with all four urinary metabolites explaining up to 6.5% of the risk (Model 3, Table S4). pCys and pCysGly individually explained 1.5 and 0.5%, respectively, of the ischemic stroke risk, with all four plasma metabolites explaining 2% of the risk. Notably, pHcy and pGSH did not contribute to the risk of stroke. Similar values were obtained using Model 1 (Table S4). Urinary sulfur-containing amino acid metabolites explained 6.5â9% stroke risk compared to just 2â2.5% explained by the plasma metabolites. Urinary and plasma sulfur-containing amino acid metabolites together explained 9â14% to the ischemic stroke risk, with the greatest contribution from pCys (1.5â2%) and uGSH (1â1.5%) (Table S4).