


In silico screening
Target preparation and molecular dynamics (MD)
The structures of metHb and metHb complexed with haptoglobin (Hp) were retrieved from the Protein Data Bank (PDB ID 3P5Q and 4X0L, respectively). Residues have been numbered according to PDB ID 3P5Q and 5VMM. Proximal and distal histidines were modelled in the delta-protonated histidine (HID) state, to maintain coordination with the heme iron and the water molecule in the cavity, respectively. Heme parameters were kindly provided by Dr. Leonardo Boechi (University of Buenos Aires), according to Refs.24,31. For parameterizing the protein, Amber-ff99SB-ILDN force field, with AmberTools 12, was used32. Both Hb structures were submitted to LEaP, to solvate the protein in a 15âÃâ15âÃâ15 à box (buffer distance of 15 à between the protein and the edge of the box), with a 3-point-charge (TIP3P) model of water; two Na+ ions were added to neutralize the system. The obtained coordinates and topology files were converted to .gro and .top with the acpype tool, and submitted to GROMACS 4.6 as input files. The system was minimised in 10,000 steps with the steepest descent algorithm in periodic boundary conditions (PBC). The thermalisation/equilibration stage was divided in four steps: in the first three steps the system was heated up from 0 to 300 K in canonical ensemble (NVT) conditions, the last step was a short MD production of 2 ns in isothermal-isobaric ensemble (NPT) conditions. The production was conducted in NVT, with the temperature fixed at 300 K for 200 ns. The output trajectory was fixed and analysed using GROMACS tools33. The clustering was performed with the medoids tool (developed by Molecular Discovery Ltd.), able to load multiple structures computationally obtained by MD trajectories, properly centred, and aligned. 20,000 conformations were extracted from each trajectory. An elliptical pocket large enough to cover the targeted region was defined, with delimitations by residues Asn9, Lys16, Glu116 on Hbα and by Asp52 and His116 on Hbβ, in all conformations. For each conformation, the four standard MIFs (H, hydrophobic (DRY), O, N1) were calculated within the pocket space. The resulting molecular interaction field (MIF) values were used as input data for a three-component principal component analysis (PCA), which allowed the trajectory clustering in the score space in which each conformation is associated with a point having three coordinates. Five clusters were generated for each trajectory and redundant centroids in terms of pocket residue conformation were discarded. The remaining conformations, plus the original X-ray structures, were used for the following SBVS analyses.
Library preparation
Three libraries of compounds, Vitas, Specs and Enamine, retrieved from the ZINC database34 (2,043,809 molecules in total), were screened against the target. For each ligand in the databases, the distribution coefficient at pH 7.4 was calculated using the MoKa software35. Molecules with logDâ<â0 were retained, so that only compounds with a high probability of staying in the bloodstream without crossing cellular membranes were considered. The most probable tautomer and protomer were calculated for each molecule. At the end of the filtering session, more than 100,000 candidates were imported in FLAP and the highest-scored compounds were visually inspected to check the absence of any anomalousness in the molecular structure.
SBVS
SBVS experiments were performed with the FLAP suite, developed and licensed by Molecular Discovery Ltd.36,37.
The structures of metHb and metHb complexed with Hp, as well as the four selected centroids extracted from the MD trajectories were imported in FLAP. The previously calculated pocket, located at the IsdBN1-Hb interface was used. The ligand databases were also generated with FLAP. When building a database, FLAP saves the MIFs associated with each conformation, the FLAP molecular fingerprint, the molecular structure and other information: in this way, the same database can be imported and screened against different targets. During the screening, the MIF quadruplets calculated for each ligand are compared to the quadruplets of the binding site in the target36. A score is given for the interaction described not only by every single probe but also by a combination of probes, so that the total set of molecules can be sorted out in decreasing order, choosing the type of interaction. In the context of this work, three probe scores (N1, N1*O, O) were used to rank VS results, for prioritizing molecules with mainly donor (N1 probe ranking), mainly acceptor (O probe ranking) or a combination of donor and acceptor (N1*O probes ranking) character. This choice was made to find polar compounds able to establish anchoring hydrogen bonds with the target, shielding key polar residues on Hb and preventing the recognition by IsdBN1. Finally, for each candidate, more than one geometry of the ligand in the binding site was inspected.
Molecular docking
GOLD version 5.5 was used to perform docking simulations and the CHEMPLP fitness function was exploited to score the poses38. Thr118 was selected as the centroid of a 12 à cavity. For each molecule, at least ten poses were generated and visually inspected to check the orientation of the complex. Asn9, Lys16, Glu116 on Hbα and Asp52 and His116 on Hbβ were identified as potentially polar anchors for docked ligands. The most promising compounds were chosen according to their docking score as well as to their pose, their capability to establish hydrogen bonds and their chemical diversity.
In vitro validation of targets
Chemicals
All reagents, if not otherwise specified, were purchased from Sigma Aldrich (St. Louis, MO, USA) at the best commercial quality available, and used as received.
Protein expression and purification
IsdB was expressed as previously described24 and purified by affinity chromatography on a StrepTactin® resin (IBA Lifesciences). Size exclusion chromatography on a Superdex 75 pg HiLoad column (GE Healthcare) connected to an ÃKTA prime (GE Healthcare) was performed to separate the protein from higher molecular weight contaminants and aggregates. The site-directed mutant Y165A (IsdB Y165A) was prepared with standard mutagenesis techniques39 and purified to homogeneity by the method optimized for the wild-type (wt) protein.
Human hemoglobin A from non-smoking donors was purified from outdated blood obtained from a blood transfusion centre as described in Ref.40.
Antibody and immunoassay reagents
Commercial Strep-Tactin®XT coated microplates (IBA Lifesciences) were purchased to exploit the protein C-terminal StrepTag®II for hemophore immobilization on the bottom of the plate. A horseradish peroxidase (HRP)-coupled anti-Hb polyclonal antibody was purchased from Abcam (Ab, Abcam ab19362). A binding buffer (2 mM EDTA, 140 mM NaCl, and 25 mM TRIS/HCl pH 7.6) was used throughout all the assays as suggested by the microplate manufacturer. A washing buffer (binding buffer containing 0.05% Tween-20) was used for all the microplate washing steps. The HRP colorimetric substrate 3,3â²,5,5â²-tetramethylbenzidine (TMB) was purchased from Acros Organics (Acros Organics, 328051000) and Merck (T4319).
Immunoassay optimization
The immunoassay was optimized using the Y165A variant of IsdB. This variant was chosen to limit the risk of oxyHb auto-oxidation. In fact, to increase the sensitivity of the assay for weak Hb binders, Hb concentration in the screening should be kept around its dissociation constant for IsdB. The dissociation constant of Hb for wt IsdB is lower (about 35 nM) than the tetramer/dimer dissociation constant of oxyHb (about 250 nM24), so oxyHb in the assays with wt IsdB is expected to be mainly in the dimeric state, which in turn is more prone to auto-oxidation41. On the other hand, the dissociation constant of oxyHb for the IsdB Y165A variant is expected to be significantly higher based on literature data17 and was indeed measured to be ofâ~â80 µM in this work. This implies that the concentration of Hb required to half-saturate IsdB is high enough to stabilize the tetrameric form of Hb, less prone to auto-oxidation.
Strep-Tactin®XT-coated microplate wells were incubated O/N at 4 °C with 2 pmol StrepTag®II- Y165A IsdB, following producerâs recommendations. The plate was washed with washing buffer and 30 µM oxyHb was added and incubated for 1 h at 4 °C. After washing the plate, Ab was added and incubated for 1 h at 4 °C. After washing, 100 μL of HRP substrate was added to the wells and the reaction developed for 30 s at 4 °C before stopping it with 100 μL of 1 N H2SO4. Different Ab dilutions (between 1:100 and 1:1500) were used to assess the effect of Ab concentration on the assay output under these conditions (Fig. S1A). While a dose-dependence of the measured signal was apparent, further dilution of the Ab (between 1:1000 and 1:10,000) did not affect the measured affinity (Fig. S1B). Using 2 pmol StrepTag®II- Y165A IsdB, 30 µM oxyHb, 1:1000 Ab dilution and three washings at each step, the effect of Hb incubation time with IsdB-functionalized wells was assessed. The signal intensity measured after 1 h did not change after 2- and 3-h incubation (Fig. S1C). The effect of increasing the number of washings from three to six on the amount of bound Hb detected was also investigated and confirmed to be negligible (Fig. S1D). The optimized protocol is reported hereafter.
Plate functionalization: 2 pmol StrepTag®II-IsdB incubated O/N at 4 °C in the Strep-Tactin®XT coated microplate. The solution is removed, and the wells washed three times with washing buffer.
Hb binding: oxyHb solution in binding buffer is added to the plate and incubated for 1 h at 4 °C. The solution is removed, and the plate washed three times with washing buffer.
Detection: an Ab solution diluted 1:1000 in binding buffer is added to the well and incubated for 1 h. The solution is removed, the plate is washed three times with washing buffer and 100 μL of HRP substrate solution is added and allowed to incubate for 30 s at 4 °C. The reaction is stopped by the addition of 100 μL 1 N H2SO4 solution. Absorption of HRP reaction product is recorded at 450 nm with a microplate reader (Dynamica Halo LED 96), and background values from TMB solutions are subtracted from each reading.
The dependence of A450 on the concentration of Hb was fitted to an isothermal equation (Eq. (1)) to calculate the dissociation constant for the complex.
$${A}_{450}=\frac{{A}_{max}\cdot [Hb]}{{K}_{D}+[Hb]}.$$
(1)
Screening of potential inhibitors of IsdB-Hb complex formation
Commercial and synthesized compounds were tested at 1 mM concentration. Since investigated molecules were expected to bind Hb, the solutions containing Hb (at a sub-saturating concentration of 30 µM) and each potential inhibitor (110 µL/well) were pre-incubated for one hour at 4 °C in the dark in a not-functionalized plate (Sarstedt AG & Co., 83.3924.500). The Hb-compound solution was then added to the functionalized well and the immunoassay procedure was followed.
The results are expressed as percentage of bound Hb, calculated with respect to the absorbance at 450 nm of the negative control. Each measurement is the average of at least three replicates, except for C35 commercial compound (two replicates). This compound gave irreproducible results in the first screening, with one outlier in the triplicate. Since the inhibitory activity of C35, despite being highly variable, appeared promising, a higher number of replicates was performed following the initial screening. The resulting average percent of bound Hb after 12 experiments was 0.42â±â0.27. This compound was later demonstrated to rearrange due to dissolution in an alkaline aqueous solution.
Compound solubilisation
The molecules under investigation were purchased from commercial suppliers (Enamine Ltd., Specs, and Vitas-M Laboratory, Ltd.) or synthesized in-house. The chemical structures of the compounds together with their MW are reported in Table 1. The first batch (C01-30) was purchased from Specs and Vitas-M Laboratory Ltd., while the second batch (C31-54) was purchased from Enamine Ltd. Deuterated (D6)-dimethyl sulfoxide (DMSO) used to solubilize the compounds was purchased from VWR Chemicals.
The commercial compounds were solubilized in aqueous solutions to reach a 50 mM concentration, taking advantage of the pH and concentration-solubility profile estimated by Chemicalize (https://chemicalize.com/ developed by ChemAxon). When the molecules resulted partially or completely insoluble, the pH was adjusted based on their estimated pH-solubility profiles using either HCl or NaOH concentrated stocks. A cycle of sonication with an ultrasonic bath (Bormac CE-5700, 41300303) was performed for those compounds that resulted insoluble after pH adjustment. If sonication was insufficient, compounds were also heated in a thermoblock at 60 °C for ten minutes. For the compounds that were still not soluble, D6-DMSO was added. For some compounds, complete solubilization required to decrease the concentration of the stock solution. In Table 2 are reported the compounds that required dilution and/or addition of DMSO for solubilization.
The in-house synthesized compounds were solubilized at 100Â mM concentration in D6-DMSO. We indicated with an asterisk (*) the in-house synthesized compounds to distinguish them from the commercial ones. C35* dissolved in D6-DMSO resulted stable by NMR and liquid chromatography, differently from commercial C35 dissolved in alkaline aqueous solution, which underwent a rearrangement due to the basic environment (data not shown). Molecules that resulted partially or completely insoluble were subjected to the same procedure followed for the commercial molecules, except for pH adjustments. The compounds that were highly insoluble were produced as TRIS salts. The chemical structures of the synthesized compound derivatives together with their MW are reported in Table 1.
Absorption spectra of the commercial compounds alone or in the presence of oxyHb were recorded with a microplate reader (TECAN Spark® 10 M) in a 384-well, UV-transparent microplate (Greiner UV-STAR® plateâ781801). The compounds were diluted in binding buffer to a 2 mM concentration, and the pH of the solutions was adjusted in the range 6.5â7.5. Compounds were then tested at 1 mM concentration to assess for any absorbance around 450 nm that might interfere with the immunoassay. The effect of compounds on the oxyHb spectrum was assessed under the same conditions in the presence of 10 µM oxyHb. The spectrum was acquired after 2 h, a delay comparable to the whole duration of the assay, including the preliminary incubation of the compound with Hb. All the incubation steps were performed at 4 °C, as in the immunoassay. Spectra were subtracted from the contribution of the blank and the compound.
Compounds synthesis
Chemicals
All chemicals were purchased by Sigma-Aldrich and used as received. Anhydrous sodium sulfate (Na2SO4) was used as drying agent for the organic phases. Organic solvents were removed under reduced pressure at 30 °C. Synthetic-purity solvents were used.
Instrumentation
Reactions were monitored by thin-layer chromatography on silica gel plates (60F-254, E. Merck) and visualized with UV light. 1H and 13C NMR spectra were recorded on a Jeol ECZ-R 600, at 600 and 150 MHz, respectively, using SiMe4 as the internal standard. The following abbreviations are used to designate peak multiplicity: sâ=âsinglet, dâ=âdoublet, tâ=âtriplet, qâ=âquartet, quintâ=âquintet, mâ=âmultiplet, bsâ=âbroad singlet. ESIâMS spectra were recorded on a Micromass Quattro API micro (Waters Corporation, Milford, MA, USA) mass spectrometer. Data was processed using a MassLynx System (Waters). The reverse-phase HPLC analyses that allowed the determination of purity for all compounds were performed with an HP 1100 chromatograph system (Agilent Technologies, Palo Alto, CA, USA) equipped with a quaternary pump (model G1311A), a membrane degasser (G1379A), a diode-array detector (DAD) (model G1315B) integrated into the HP1100 system. Data analysis was done using an HP ChemStation system (Agilent Technologies). The analytical column was a LiChrospher RP-18e 100 A (250âÃâ4.6 mm, 5 μm particle size) (Merck, Darmstadt, Germany). The mobile phase consisted of acetonitrile/water (80/20 v/v) with 0.1% trifluoroacetic acid and the flow-rate was 1.2 mL/min. The injection volume was 20 μL (Rheodyne, Cotati, CA). All compounds wereââ¥â95% pure.
Hydrazide 1 was obtained by reaction of commercially available methyl 1H-indole-3-carboxylate with hydrazine in EtOH under reflux. Reaction of hydrazide in the presence of KOH and CS2 yielded the oxadiazole-thiol derivatives (5â8). Nucleophilic substitution between oxadiazole-thiol derivatives and bromoacetamido-benzoic acid derivatives (9, 10) in acetone or acetonitrile under reflux, in presence of K2CO3, gave C35, C59, C61, C63 and C65 (Scheme 1).
Synthesis of C35, C59, C61, C63 and C65. (a) KOH, CS2, EtOH, reflux, 4Â h. (b) K2CO3, acetone or CH3CN, reflux.
C35, C59, C61, C63 and C65 were then salified with TRIS to increase their solubility in water (C35 TRIS, C59 TRIS, C61 TRIS, C63 TRIS and C65 TRIS).
Urea or 1-methylurea were reacted with 4-chlorobutanoyl chloride in benzene and H2SO4, under reflux for 3Â h and then at r.t to obtain 11 or 11a chlorides. 11 and 11a were converted into their respective iodinated derivatives 12 and 12a by reaction with NaI in acetone under reflux. The thiocyanates derivatives 13 and 13a were obtained by reaction of 12 and 12a with KSCN in acetone under reflux. The reaction of 13 and 13a with thiosemicarbazide in TFA under reflux gave the final compounds C44 and its methylated derivative C60 (Scheme 2).
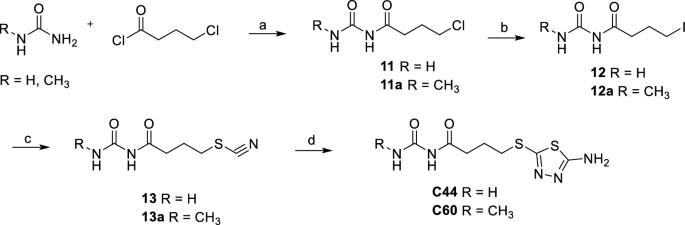
Synthesis of C44 and C60. (a) H2SO4, benzene, reflux for 3Â h then r.t. for 12Â h, 80%, 84%. (b) NaI, acetone, reflux, 8Â h, 62%, 79%. (c) KSCN, acetone, reflux, 4Â h, 65%, 90%. (d) Thiosemicarbazide, TFA, reflux, 4Â h, 29%, 30%.
C53 was obtained by a reaction between 4-hydrazineylbenzoic acid and methyl 2-oxo-2-(2-oxotetrahydrofuran-3-yl) acetate in MeOH/CH3COOH in the presence of Et3N at r.t. The hydrolysis of C53 with 1Â M NaOH in MeOH gave the acid derivative C58 (Scheme 3).
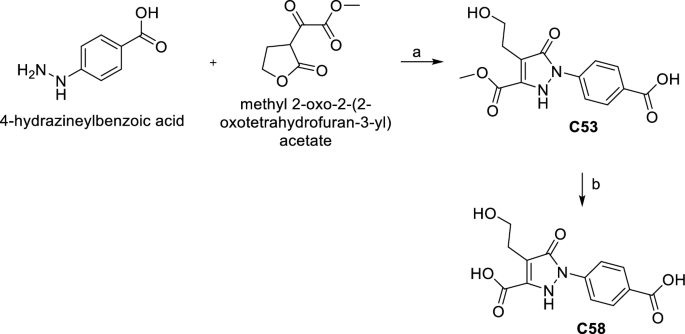
Synthesis of C53 and C58. (a) Et3N, CH3COOH, MeOH, r.t. 24Â h, 37%. (b) 1Â M NaOH, MeOH, r.t. 12Â h, 88%.
The experimental protocol and characterization for the synthetized compounds are reported in the Supplementary Information.
Validation of the binding of the most promising compounds to Hb
STD-NMR
Hb samples for STD-NMR were diluted at a concentration of 20 µM (heme concentration) in a 50 mM sodium phosphate buffer, pH 7.6, prepared with 100% D2O, previously equilibrated with CO. Commercial compounds C35, C41, C44, and C53 and in-house synthesized compounds C35* and C53* were analysed. The concentrated stocks of the commercial compounds were prepared in water, as previously reported, while the in-house synthesized compounds were dissolved in D6-DMSO before further dilution in the measuring buffer. Compounds were added to the protein solution to a final concentration of 1 mM (molar ratio of Hb/compound of 1:100).
STD-NMR experiments were performed using a Jeol ECZ-R 600 (600 MHz spectrometer) at 25 °C. NMR spectra were acquired with 64 k data points and 256 scans using a spectral window of 9025 Hz. Water signal suppression was carried out to eliminate signals from trace amounts of H2O using a watergate pulse sequence. For selective saturation, cascades of Gaussian-shaped pulses (field strength of 92 Hz) with a length of 30 ms were applied. An interpulse delay of 3 ms between successive pulses was applied, for a saturation time of 6 s. On-resonance and off-resonance spectra were obtained by selective irradiation at 0.6 ppm and 40 ppm, respectively. A Tp1 filter of 50 ms was applied to remove protein peaks. Spectra were analysed using MESTRENOVA 14.2.1 (Mestrelab Research, S.L, Santiago de Compostela, Spain). Group Epitope Mapping (GEM) was performed on the STD spectra assigning the highest saturated signal to 100%, and all other peaks were normalized accordingly.
Isothermal titration calorimetry (ITC)
Experiments were performed in triplicate at 25 °C using 100 µM HbCO (heme concentration, hence 25 µM Hb tetramer, the species present in solution at this concentration) and 500 µM C35*. The compound used was a C35* stock without TRIS (i.e. not a TRIS salt), since TRIS is notoriously not ideal as buffer for ITC given its high ionization enthalpic contribution42. Indeed, the first attempts with C35* TRIS salt did not give satisfactory results (data not shown). All solutions were prepared in a 50 mM HEPES buffer, pH 7.6. C35* was first dissolved in a concentrated 100 mM stock in DMSO and then diluted in the final buffer to a concentration of 500 µM, at which the compound was soluble. Solutions were degassed for 10 min under vacuum before the titration. HbCO was obtained by adding to the oxyHb stock a buffer previously equilibrated with CO. DMSO was added to the Hb solution at a final concentration of 0.5% to balance the amount of DMSO in the C35* solution.
ITC titrations were carried out using a MicroCal PEAQ-ITC (Malvern, Malvern, UK). C35* was added to the instrument measurement cell, containing 200 μL of HbCO, by a first addition of 0.4 μL and 18 subsequent additions of 2 μL. A time interval of 150 s was set between the addition of each aliquot of C35*. To subtract the dilution heat, an experiment (also in triplicate) was performed in which the reaction cell was filled only with the buffer solution with 0.5% DMSO, while the syringe was filled with 500 µM C35*. Experiments were performed under continuous stirring at 750 rpm. A UVâvis spectrum of the protein was acquired after the titration and confirmed that HbCO did not oxidize during the experiment (data not shown).
Binding isotherms were obtained by the integration of each injection peak followed by subtraction of the control (dilution) experiment. The Hb concentration used for the fitting was 25 µM (concentration of the tetramer). Titration curves were fitted using a model containing one set of identical sites using the MicroCal PEAQ Analysis Software version 1.40 developed by Malvern (Malvern Instruments Ltd.: Microcal PEAQ-ITC Analysis Software, Malvern, UK).