Several Acanthaceae species exhibit a far-red shift in their fluorescence spectra
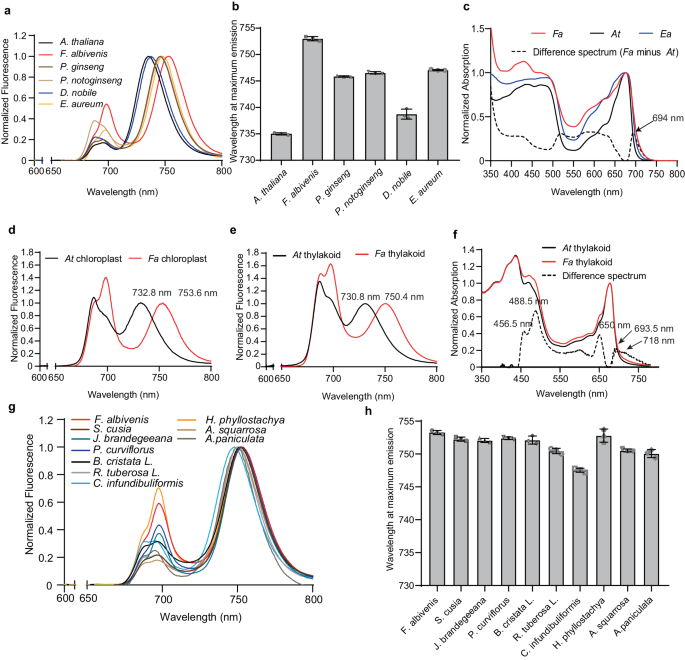
We obtained plants from three understory traditional Chinese medicine species, Panax ginseng, Panax notoginseng and Dendrobium nobile, and two houseplants, Epipremnum aureum and Fa, to test their ability to use far-red light for photosynthesis by measuring their 77-K fluorescence emission spectra. Whereas At has a λmax of 735 nm, we observed a mean red shift for λmax of ~11.2 nm, ranging from 3.7 nm (D. nobile) to 18 nm for Fa, with a peak of 753 nm (Fig. 1a, b). We further determined the absorption spectra of two fluorescence red-shifted leaves, Fa and Epipremnum aureum, and the results showed that both had significant red-shifts, with Fa being the more red-shifted. The difference spectra between Fa and At showed that Fa absorption more light longer than 694 nm (Fig. 1c). To avoid possible interference from chlorophyll concentration on fluorescence spectroscopy, we repeated the 77-K fluorescence emission spectra using isolated chloroplasts and thylakoid membranes from Fa leaves. We detected one main red-shifted peak at 753.6 nm from Fa (Fa) chloroplasts, together with additional peaks at 685 nm and 695 nm (Fig. 1d). Purified Fa thylakoid membranes showed a similar fluorescence emission pattern but with a more moderate red shift at 750.4 nm (Fig. 1e). We also determined the absorption spectrum of thylakoids from Fa and At at room temperature to mimic normal growth conditions: the difference between the two spectra revealed a higher absorption spectrum for Fa thylakoids compared to At thylakoids in four main wavelength ranges, 690–750 nm, 645–655 nm, 465–500 nm and 440-465 (Fig. 1f). Specifically, we observed two major peaks at 488.5 nm and 650.5 nm, suggesting that Fa thylakoids contain more Chl b molecules than At thylakoids, as well as a peak at ~693.5 nm and a shoulder at 718 nm, which could be caused by the presence of more red-shifted Chls (red Chls) in Fa thylakoids than in At thylakoids. These results suggest that Fa chloroplasts absorb more far-red light than those of At, offering a possible explanation for the strong red-shifted fluorescence emission spectrum obtained in this species.
a Low-temperature (77-K) fluorescence emission spectra of Arabidopsis thaliana (At), three understory traditional Chinese medicine plants (P. ginseng, P. notoginseng and D. nobile) and two houseplants (E. aureum and F. albivenis [Fa]). b Wavelength of maximum fluorescence emission (λmax) of the plant species from (a) Error bars (standard deviation) were calculated from three different experimental units (n = 3 independent experiments), and data were presented as mean values ± SD. c The absorption spectra of leaves from At, Ea and Fa. The absorption spectra were normalized to the maximum in the red region, which was set to 1. The differential absorption spectrum between Fa and At is shown as a dashed line. d, e 77-K fluorescence emission spectra of chloroplast (d) and thylakoid membranes (e) from Arabidopsis and Fa. f Absorption spectra at room temperature of At thylakoids and Fa thylakoids. The differential absorption spectrum between Fa thylakoids and At thylakoids (multiplied by 5) is shown as a dashed line, with peaks at 456.5 nm, 488.5 nm, 650 nm, and 693.5 nm and the shoulder at 718 nm indicated by arrows. g 77-K fluorescence emission spectra of the ten Acanthaceae plants Fa, S. cusia, J. brandegeeana, P. curviflorus, B. cristata, R. tuberosa, C. infundibuliformis, H. phyllostachya, A. squarrosa and A. paniculata. h Wavelength of maximum fluorescence emission for plants shown in g Error bars (standard deviation) were calculated from three different experimental units (n = 3 independent experiments), and data were presented as mean values ± SD. The fluorescence emission spectra were collected following excitation at 440 nm and normalized with respect to their wavelength at maximal emission in the far-red region (750 nm), which was set to 1. The data are based on three independent experiments, each producing similar results.
The strongly red-shifted fluorescence emission detected using leaves, chloroplasts and thylakoid membranes of Fa (Fig. 1a–e) is unique among land plants. Fa is a native of the rainforests of South America that belongs to the family Acanthaceae. We therefore measured the 77-K fluorescence emission spectra of nine other Acanthaceae species. Notably, all 10 species showed enhanced far-red fluorescence emission, ranging from 748 nm in C. infundibuliformis to over 750 nm in the other species (Fig. 1g, h). We conclude that the pronounced red shift in the fluorescence emission spectra may be an important feature of the Acanthaceae.
Fluorescence emission red shift is associated with the PSI–LHCI in Fa
As Fa has soft, thick leaves that are easily ground for isolation of chloroplasts and thylakoid membranes, we chose this species as the source from which to isolate photosynthetic pigment–protein complexes and explore the reason for the red-shifted fluorescence (Supplementary Fig. 2a). As control, we purified pigment–protein complexes from At thylakoids. Sucrose density ultracentrifugation of At thylakoids treated with the detergent n-dodecyl-β–d-maltoside (β-DDM) resulted in four pigment-containing bands (Supplementary Fig. 2b), whose polypeptide composition we analyzed by SDS-PAGE. Band 1At and Band 2At were close together in the sucrose gradient and were assigned as LHCII monomers and trimers, respectively36. Band 3At contained mainly the PSI and PSII cores, whereas Band 4At comprised mainly PSI–LHCI (Supplementary Fig. 2c). The same isolation procedure applied to β-DDM-treated Fa thylakoids returned three main pigment-containing bands. Band 1Fa was much lighter than Band 2Fa, suggesting a low ratio of LHCII monomers to trimers. The lowest band in the gradient (Band 3Fa) migrated at the same position as Band 4At and contained mainly PSI–LHCI and a small fraction of PSII core. Finally, Fa thylakoids lacked a band corresponding to Band 3At (Supplementary Fig. 2b, c), suggesting differences in the organization of pigment–protein complexes between At and Fa thylakoid membranes.
We subjected all bands isolated from Fa thylakoid membranes to 77-K fluorescence emission spectroscopy (Supplementary Fig. 2d). Bands 1Fa and 2Fa each had one main emission peak at 680 nm, suggesting that LHCII does not contribute to the strongly red shift in chlorophyll fluorescence. In sharp contrast, Band 3Fa showed a major emission peak at 745.4 nm (F745) and a broad secondary peak at 685–695 nm (F685/695). As a peak around 690 nm is characteristic of PSII upon 77-K fluorescence spectrometry37, the F685/695 secondary peak is consistent with the presence of a small fraction of PSII core. The peak at 745 nm can thus be attributed to the PSI–LHCI supercomplex, suggesting that this supercomplex plays a role in the red shift in chlorophyll fluorescence in Fa. As λmax was 753 nm in leaves and chloroplasts but only 750 nm in purified thylakoid membranes and 745 nm for the PSI–LHCI supercomplex (Fig. 1 and Supplementary Fig. 2d), we suspect that additional factors may stabilize the far-red forms of PSI–LHCI in Fa. In addition, we determined the pigment composition of Fa PSI–LHCI by high-performance liquid chromatography (HPLC) analysis, resulting in the detection of Chl a, Chl b, violaxanthin, lutein and β-carotene (Supplementary Fig. 3), which are also present in the PSI–LHCI supercomplexes of At38, spinach (Spinacia oleracea)39, pea (Pisum sativum, Ps)5 and maize (Zea mays, Zm) thylakoid membranes8.
Despite the similar pigment composition of PSI–LHCI of Fa (Fa PSI–LHCI) and PSI–LHCI of At (At PSI–LHCI), their 77-K fluorescence emission spectra differed markedly, with λmax of 745.4 nm and 731.8 nm, respectively (Supplementary Fig. 4a), prompting us to measure their absorption spectra at room temperature. Unexpectedly, although Fa thylakoids displayed greater absorption than At thylakoids at wavelengths >700 nm, Fa PSI–LHCI and At PSI–LHCI had nearly identical absorption spectra at room temperature in the red and far-red regions, with small differences around 450–500 nm due to Chl b and carotenoids (Supplementary Fig. 4b). The loss of far-red absorption by PSI–LHCI suggests that the acting force of the thylakoid membrane helps control the red shift in fluorescence. Once PSI–LHCI particles dissociate from the thylakoid membrane, the spectral properties of red Chls from Fa and At are very similar based on absorption spectroscopy at room temperature. We therefore turned to 77-K fluorescence emission spectroscopy to characterize the spectral properties of PSI subfractions below.
The far-red fluorescence emission of Fa PSI–LHCI depends on interactions between the PSI core and LHCI
To further characterize the PSI core complex and its bound LHCI, we treated the PSI–LHCI sample with a combination of β-DDM and the zwitterionic detergent 3-(N,N-dimethylpalmitylammonio) propanesulfonate (zw 3-16) and then subjected the samples to sucrose density gradient ultracentrifugation. We detected three dark green bands (Bands 1, 2 and 3) and then assessed their polypeptide composition by SDS-PAGE (Supplementary Fig. 4c,d). Bands 1 and 2 from the sucrose density gradient resolved as two main bands of Lhca subunits, suggesting that Band 1 is a mixture of Lhca monomers (LHCI-1 thereafter), whereas Band 2 may be a polymer of Lhca subunits (LHCI-2 thereafter). We assigned Band 3 to the PSI core complex, as it mainly contained the largest subunits, PsaA and PsaB, and several small subunits of the PSI core. We determined the 77-K fluorescence emission spectra of Bands 1–3 (Supplementary Fig. 4e). The PSI core (Band 3) showed a main peak at 721.6 nm (F721.6), similar to the emission peak of the PSI core complex from some algae and flowering plants39,40,41,42,43. LHCI-1 (Band 1) displayed a main peak at 679.4 nm (F679.4) and a minor broad peak with a maximum between 730 nm and 740 nm, similar to the emission peak of LHCI-680, a LHCI fraction isolated from some flowering plants39,40,41,44,45. LHCI-2 (Band 2) showed a main peak at 686 nm (F686), as well as a secondary peak at 737.8 nm (F737.8) with an 8-nm red shift relative to the emission peak of LHCI-730, the other isolated LHCI fraction in some flowering plants39,40,41,44,45. Notably, the red-shifted F737.8 peak was still blue-shifted by ~8 nm compared to the main fluorescence peak of Fa PSI–LHCI at 745.4 nm (Supplementary Fig. 4e).
Thus, the fluorescence emission peaks of red Chls in Fa undergo a gradual blue shift from PSI–LHCI within the thylakoid membrane, to PSI–LHCI isolated from the thylakoid membrane, and to LHCI. We hypothesize that some intrinsic structural elements of Fa LHCI, absent from other plant LHCI, enable its red emission shift (737.8 nm). Looking at the whole PSI–LHCI supercomplex, the interactions of LHCI with the PSI core complex may enhance the extent of the red shift to reach 745.4 nm; finally, within thylakoids and chloroplasts, the binding of the PSI–LHCI supercomplex to the thylakoid membrane further increases the red shift to 750 nm and 753 nm, respectively. Thus, Fa likely possesses the strongest far-red-shifted fluorescence emission among land plants due to three consecutive enhancements of red-shift levels.
Architecture of the PSI–LHCI supercomplex from Fa
To reveal the detailed structure of Fa PSI–LHCI and explore the relationship between its structure and its observed red shift in fluorescence emission, we determined the structure of Fa PSI–LHCI by cryo-EM. Briefly, automated particle picking selected 3.7 million positions from 12,023 cryo-EM micrographs. Through multiple rounds of 2D classification, heterogeneous refinement and 3D variability analysis, we identified the most representative and highest-quality particles, from which we used a subset of 157,342 particles to reconstruct a cryo-EM map of Fa PSI–LHCI at a global resolution of 2.46 Å (Supplementary Fig. 5; Supplementary Table 1). We identified 18 protein subunits, 162 Chls, 37 carotenoids, three iron-sulfur (Fe4S4) clusters and nine lipids in the structure of the Fa PSI–LHCI supercomplex (Fig. 2, Supplementary Fig. 6 and Supplementary Table 2). We describe the structural features of the Fa PSI–LHCI supercomplex and their functional implications below.
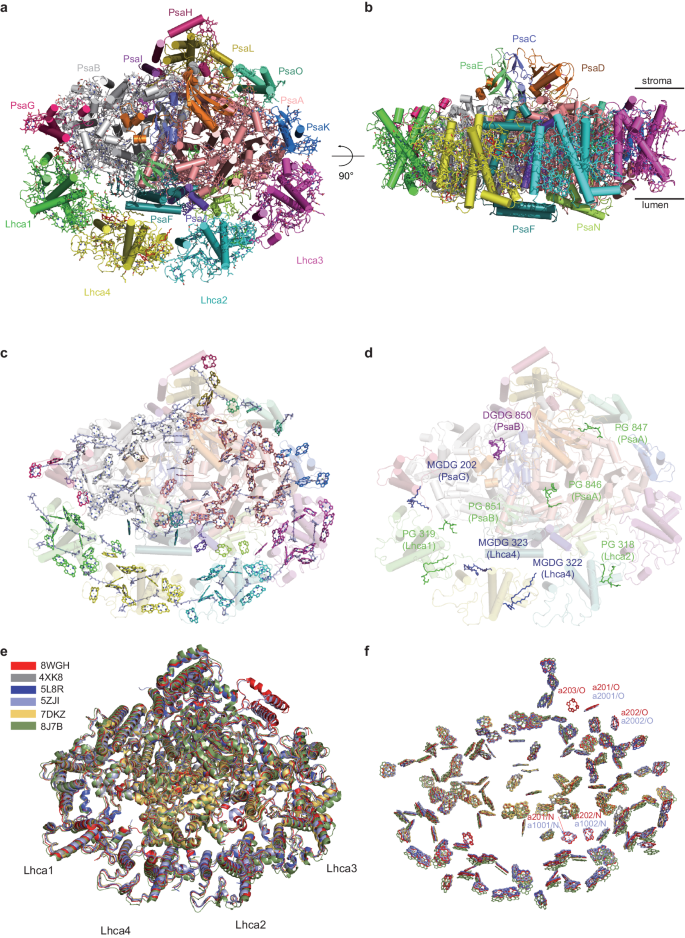
a, b View along the membrane normal from the stromal side (a) and along the membrane plan from the LHCI side (b). Protein subunits are shown as ribbon models and colored differently. c Pigment arrangement in the Fa PSI–LHCI supercomplex. Chls are shown as stick models in the same color as their interacting protein subunits in a, and carotenoids are shown as stick models in light blue. d Distribution of lipids in Fa PSI–LHCI. Five phosphatidyl glycerol molecules (PG, green), three monogalatosyl diglyceride molecules (MGDG, blue) and one digalactosyl diacylglycerol molecule (DGDG, magenta) are depicted as stick models. e, f Overlay of the Fa PSI–LHCI structure (PDB code 8WGH, red) with that of maize PSI–LHCI (Zm PSI–LHCI, PDB code 5ZJI, light blue), At PSI–LHCI (PDB code 8J7B, smudge) and pea PSI–LHCI (Ps PSI–LHCI, PDB code 4XK8, gray; 5L8R, tv_blue; 7DKZ, yellow) based on PsaA viewed along the membrane normal from the stromal side, with the protein structure and the chlorophyll arrangement shown in (e) and f, respectively. In c and f, the phytol chains of all Chls have been deleted for clarity.
The overall structure of Fa PSI–LHCI consists of two moieties—the PSI core complex and its peripheral LHCI belt (Fig. 2a, b)—that are very similar to the structures reported for PSI–LHCI from land plants4,5,7,46. As the Fa genome sequence is not currently available, we determined the sequences of the genes encoding four Lhca subunits and some PSI core subunits (Supplementary Fig. 7 and Supplementary Fig. 8). The Fa PSI core complex is composed of nine transmembrane subunits (PsaA, PsaB, PsaF, PsaG, PsaH, PsaI, PsaJ, PsaK and PsaL), three extrinsic subunits (PsaC, PsaD and PsaE) at the stromal side and one (PsaN) at the lumenal side, and the LHCI belt composed of four Lhca subunits (Lhca1 to Lhca4) binds to the PSI core complex at the PsaG-PsaF-PsaJ-PsaK side (Fig. 2a, b). Notably, we observed PsaO and PsaN subunits in the Fa PSI–LHCI structure (Fig. 2a, b and Supplementary Fig. 9a). PsaO, which is critical for associating LHCII with the PSI core complex to assemble the PSI–LHCI–LHCII supercomplex and to functionally favor energy transfer from LHCII to the PSI core complex in green algae and land plants during state 2 (refs. 47,48,49,50), which with the similar function as the subunit of PsaK, PsaL, PsaH and possibly PsaP51,52,53,54, is located at the outermost edge of the PSI core complex, and is thus typically absent in previously reported purified PSI–LHCI structures. Fa PsaO has a structure similar to those of PsaO from the moss Physcomitrium patens (Pp)50, the green alga Chlamydomonas reinhardtii (Cr)48,49, and the red alga Cyanidioschyzon merolae (Cm)55, which are composed of a shorter TMH B, an amphipathic helix C at the lumenal side, and a longer TMH A from the N-terminal to its C-terminal end, although we noticed some differences in loops AC and BC between Fa PsaO, Pp PsaO and Cm PsaO (Supplementary Fig. 9b). Fa PsaO binds three Chls (a201, a202 and a203) and two transmembrane β-carotenes (BCR204 and BCR205), forming two pigment clusters residing at either side of the crossed TMHs A and B. One cluster is composed of two Chls (a201 and a203) close to the lumenal side and of one β-carotene (BCR204); the other cluster comprises one Chl (a202) close to the stromal side, whose phytol tails protrude into PsaA, and one β-carotene (BCR205) (Supplementary Fig. 9b). Comparison of the pigment arrangement in Fa PsaO and that of land plants (Zm and Pp), a green alga (Cr) and a red alga (Cm) revealed extensive similarity, although with fewer pigments were assigned in the structures of Zm PsaO (two Chls), Cm PsaO (three Chls) and Pp PsaO (three Chls and one β-carotene)8,50,55, and an almost identical pigment pattern in Cr PsaO and Fa PsaO (Supplementary Fig. 9b). These results suggest that Fa PsaO may have functions similar to those previously reported for other plant PsaO proteins.
The PsaN subunit is easily detached from the PSI core due to its loose association, explaining how it is missing from structures containing the PSI core, with the exception of the maize (Zm) PSI–LHCI–LHCII structure8. Importantly, we resolved PsaN in the Fa PSI–LHCI structure. Superposition of the Fa PSI–LHCI structure with that of Zm PSI–LHCI revealed that Fa PsaN is in the same location within Fa PSI–LHCI as Zm PsaN is within Zm PSI–LHCI (Supplementary Fig. 9c). Fa PsaN has two directly connected helices (A and B) at its N terminus, a long loop BC and a short helix C followed by a long C-terminal loop, similar to the structure of maize PsaN (Supplementary Fig. 9d). Helices A and B bind to the lumenal region of PsaA, PsaF and PsaJ, while loops as well as two Chls (a201 and a202) fill in a large gap between PsaA and Lhca2 at the lumenal side (Supplementary Fig. 9e), supporting a role for PsaN in building direct EET pathways from Lhca2 to the PSI core complex, which was suggested for PsaN in Zm PSI–LHCI8.
An amino acid sequence alignment showed high conservation for each of the four groups of Lhca subunits (Lhca1, Lhca2, Lhca3 and Lhca4) among Fa, At, pea and maize (Supplementary Fig. 7). Based on their predicted amino acid sequences and relative positions around the PSI core, we assigned the four Lhca subunits in Fa PSI–LHCI as Lhca1, Lhca4, Lhca2, and Lhca3 from PsaG to PsaK when viewed from the stromal side (Fig. 2a). The four Lhca subunits are in the same order in Ps PSI–LHCI4,5,7 and Zm PSI–LHCI8. Although there is a possibility of relative movement of antennae relative to the core complex, such as in the PSI-IsiA complex56, the results of the 3D variability analysis showed that there were no obvious variances in the positions of Lhca relative to the PSI core in Fa PSI-LHCI (Supplementary Movie 1).
When the Fa PSI–LHCI structure and the five PSI–LHCI structures from maize (PDB code 5ZJI), At (PDB code 8J7B)57 and pea (PDB codes: 4XK8, 5L8R and 7DKZ) are superposed based on PsaA, we discovered that their PSI core complexes as well as the chlorophyll molecules they are associated with are in similar positions, while their LHCI belts and associated chlorophyll molecules show some shifts (Fig. 2e,f). To assess the extent of these shifts, we measured the inter-Mg distance (Mg-to-Mg distance) between Chl a801PsaA, one of the special pair (the primary electron donor of photosystem I), and Chl a603 in each Lhca subunit in these PSI–LHCI structures (Supplementary Table 3). We obtained average distances across all five published structures of 63.7 Å from Chl a603Lhca1, 55.7 Å from Chl a603Lhca2, 63.3 Å from Chl a603Lhca3 and 58.4 Å from Chl a603Lhca4. The Fa LHCI belt was slightly farther away from the PSI core complex than that of other structures, with distances of 64.6 Å from Chl a603Lhca1, 56.0 Å from Chl a603Lhca2, 64.0 Å from Chl a603Lhca3 and 59.3 Å from Chl a603Lhca4. These results suggest that the interactions between the PSI core complex and the LHCI belt might be different among the six PSI–LHCI structures.
Structure of Fa LHCI
All Fa Lhca subunits comprise three major TMHs B, C and A and a short amphipathic helix D from their N termini to C termini, with three loop regions: an N-terminal loop, loop BC and loop AC (Fig. 3a). Each Fa Lhca subunit binds 14 or 15 Chl molecules, which are distributed into two layers, one close to the stromal side and the other close to the lumenal side. At the stromal layer, eight Chl molecules (a/b301, a302, a303, a/b308, a309, a310, a311 and a312) are located around TMHs A and B; at the lumenal layer, three Chl molecules (a304, a/b306 and a/b307) are located at the interface between TMHs B and C and two Chl molecules (a313 and a314) are located at the helix A-turn-helix D region. Besides these conserved Chl-binding sites, each Lhca binds 1–2 unique Chl molecules and 3–4 carotenoids (Fig. 3a).
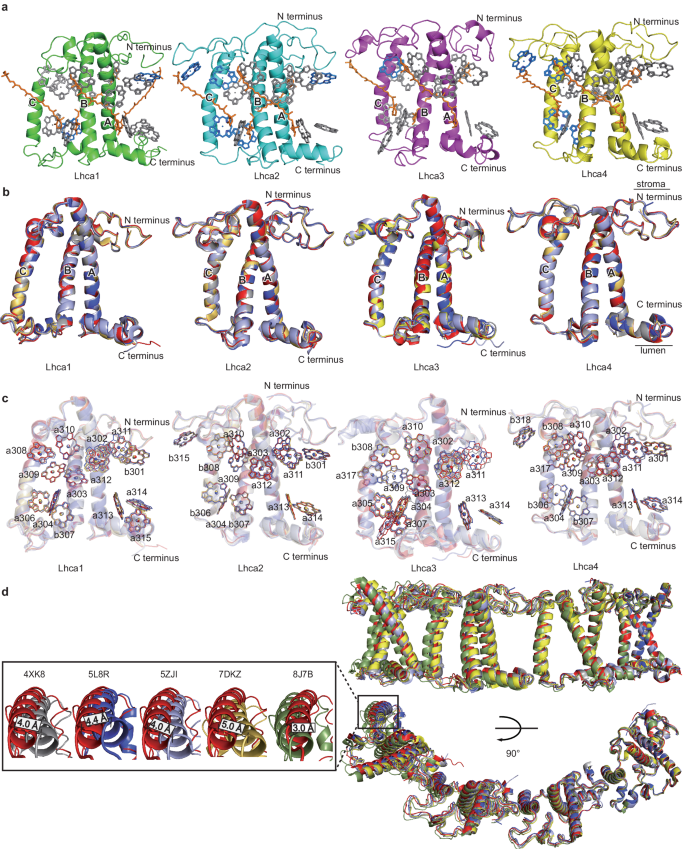
a Structure of Lhca1, Lhca2, Lhca3 and Lhca4 from F. albivenis. Each Lhca is shown as ribbon model with the same color code as in Fig. 2a. Color codes: gray, Chls a; blue, Chls b; orange, carotenoids. b, c Overlay of each of the four Fa Lhca apoprotein structures (PDB code 8WGH, red) (b) and pigment arrangement (c) and the corresponding structures from maize PSI–LHCI (PDB code 5ZJI, light blue) and pea PSI–LHCI (PDB code 4XK8, gray; 5L8R, tv_blue; 7DKZ, yellow). d Superposition of the LHCI belt based on Lhca3 between the six land plants PSI–LHCI structures. Shifts between helix CFa Lhca1 and helix Cmaize/pea/At Lhca1 are enlarged. The structure of PSI–LHCI from Arabidopsis thaliana is also included (PDB code 8J7B, smudge).
To look for structural differences between Fa Lhcas and Lhcas from other flowering plants, we compared the structures of each Lhca group individually and within the entire LHCI belt by using the five PSI–LHCI structures (PDB codes: 8WGH, 5ZJI, 4XK8, 5L8R and 7DKZ) (Fig. 3b–d). For each Lhca group, structural superposition of each member showed a very high conservation in the three TMHs and loop regions, although Fa Lhca1 and Fa Lhca3 differed in their C-terminal loop regions (Fig. 3b). In addition, all Chl-binding sites are conserved between Fa, maize and pea, as are all amino acids coordinating to the central Mg atoms of Chl molecules, with the exception of one additional Chl a315 binding to the outer margin of Fa Lhca3 and Zm Lhca3 (Figs. 2f and 3c, Supplementary Fig. 7). These results indicate that the structure of each Lhca is highly conserved between different flowering plants.
Furthermore, we superposed the Fa LHCI belt structure with those of LHCI belts from the other five published PSI–LHCI structures based on the Lhca3 subunit, which revealed some shifts between the six LHCI structures, with At LHCI exhibiting the greatest shifts, followed by Fa LHCI (Fig. 3d). To quantify these shifts, we measured the distance between helix CFa Lhca1 and helix Cothers Lhca1, as helix CLhca1 is the farthest helix from Lhca3 and will reflect the cumulative effect of any shift affecting each Lhca. We detected a 3 Å distance between helix CFa Lhca1 and helix CAt Lhca1, and a 4–5 Å distance between helix CFa Lhca1 and each of helix C from other Lhca1s (Fig. 3d). These shifts may be related to a variety of factors, including the PSI-LHCI structure itself, the technical approach used, and whether or not it is combined with LHCII. however, here we focus on the possible relationship between shifts and the PSI-LHCI structure. As each Lhca can interact with adjacent Lhcas within the LHCI belt and with the PSI core complex, the different shifts observed here suggest differences in these interactions, in turn regulating the three-dimensional PSI–LHCI structure. Whether these differences affect the spectral red shift is unknown. LHCI can exist in three possible states: (i) in PSI–LHCI particles embedded in the thylakoid membrane; (ii) in isolated PSI–LHCI particles; and (iii) dissociated from the PSI core. Compared to PSI–LHCI particles in situ, isolated PSI–LHCI particles lose the acting force from the thylakoid membrane; similarly, separated LHCI no longer interacts with the PSI core. In each state, the local environment of red Chls and their conformation may thus differ, which may contribute to their spectral differences in all plant species, but not to great differences in chlorophyll fluorescence between Fa and other plant species. To investigate possible structural changes related to the energy state of red Chls, we compared Fa Lhca structures to those of other Lhcas in more detail below.
Structure elements possibly enhancing far-red forms in Fa Lhca3
To explore structural elements in Lhcas that may lead to the red-shifted spectral forms in Fa, we examined the coordination of the red Chl dimer (a303 and a309) in each Fa Lhca subunit. In all Fa Lhcas, Chl a309 is coordinated by a glutamate residue in TMH C (GluTMH C), while the coordinating amino acid for Chl a303 varied, with HisTMH B in Fa Lhca1 and Fa Lhca2 and AsnTMH B in Fa Lhca3 and Fa Lhca4 (Fig. 4). The coordination pattern of the red Chl dimer in Fa was identical to that in pea and maize4,5,7,8, ruling out coordinating amino acids as causal structural elements for the red shift seen in Fa compared to common flowering plants.
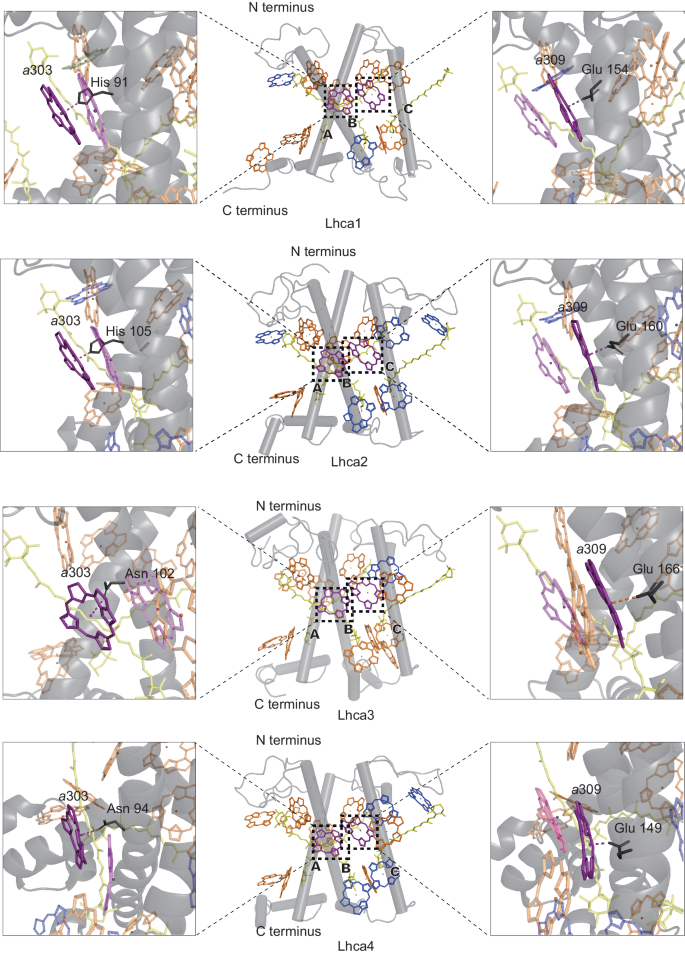
Dashed boxes represent the enlarged views showing amino acids as ligands for the central Mg of Chl a303 and Chl a309. Color codes: purple, Red Chls a; orange, other Chls a; blue, Chl b; yellow, carotenoids.
We then focused on the local environment of Chl a303 and Chl a309 in each Fa Lhca and compared them to that in the corresponding pea and maize Lhca. Although Lhca1, Lhca2 and Lhca4 differed little between the three plant species (Supplementary Fig. 10), Fa Lhca3 displayed three regions that were distinct relative to Lhca3 from pea and maize (Fig. 5). First, four continuous amino acid residues (88–91, Phe-Trp-Phe-Gln) located in the N-terminal loop of Fa Lhca3 and next to TMH B, form a large canopy for Chl a303 and Chl a309 due to the large benzene ring side chains of Phe and Trp; by contrast, the corresponding amino acids in pea and maize Lhca3 are Gly-Phe-Ile-Glu, with smaller side chains than in Fa Lhca3, thus forming a much smaller canopy for Chl a303 and Chl a309 (Fig. 5b, c, region I). The porphyrin rings of Chl a303 and Chl a309 in all Lhca3 structures have two sides—one facing TMHs B and C, whose two residues provide ligands to the central Mg atoms of the two Chls, and the other facing the PSI core complex; the long phytyl tails of Chl a303 and Chl a309 protrude towards the stromal side and become bent to the core side once touch the middle two residues of the canopy region, causing steric hindrance for the phytyl tails (Fig. 5b, region I). Therefore, the size of the canopy, and especially the size of the middle two residues, may affect the conformation of Chl a303 and Chl a309. To quantify the steric hindrance effect, we compared the structure of Chl a303Fa Lhca3 to that of Chl a303Ps Lhca3 and Chl a303Zm Lhca3: the phytyl chain of Chl a303Fa Lhca3 was bent closer to the core side (Supplementary Fig. 11), which might be caused by a larger steric hindrance from the stromal canopy in Fa Lhca3.
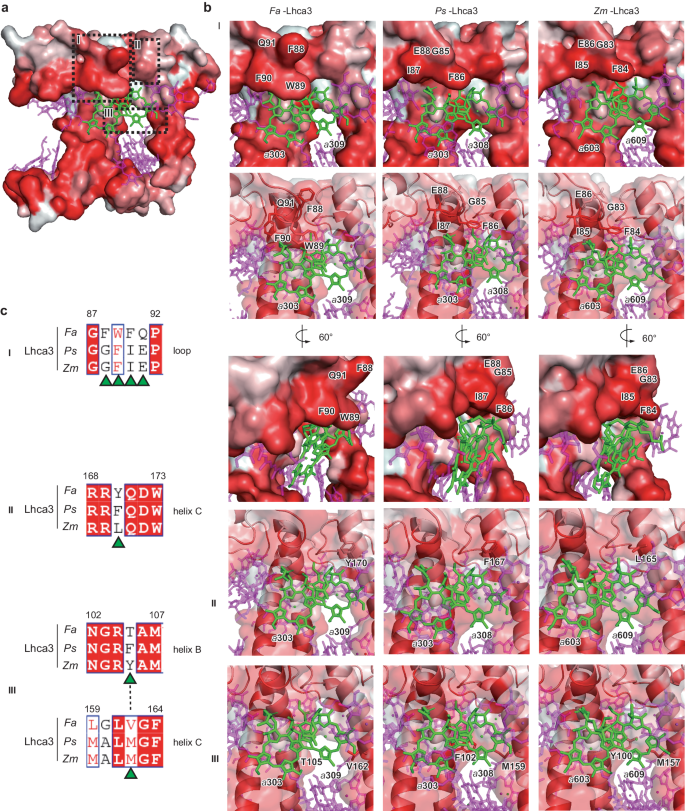
a Structure of Fa Lhca3 showing the extent of surface hydrophobicity. The degree of hydrophobicity is shown from white (no hydrophobicity) to red (high hydrophobicity). The black dashed boxes indicate three regions (I, II and III) surrounding Chl a303 and Chl a309, with different amino acid residues between Fa Lhca3, pea (Pisum sativum, Ps) Lhca3 and maize (Zea mays, Zm) Lhca3. b Enlarged views of boxed areas I–III) in Fa Lhca3 and the structure of the corresponding area in Ps Lhca3 and Zm Lhca3. c Sequence alignment of regions I–III from Fa Lhca3, Ps Lhca3 and Zm Lhca3. Color codes: Chl a303 and Chls a309, green; other Chl molecules, purple. PDB codes: Fa PSI–LHCI, 8WGH; Ps Lhca3, 4XK8; Zm Lhca3, 5ZJI.
Second, an amino acid residue surrounding Chl a309, polar Tyr-170 in TMH C, is located within 4 Å from Chl a309 in Fa Lhca3; in other species, this residue is replaced by nonpolar Phe (pea Lhca3) or Leu (maize Lhca3), leading to differences in hydrophobicity (Fig. 5b, c, region II). Third, there is a large gap between TMHs B and C in the neighborhood of Chl a309 in Fa Lhca3, with the nearest distance between Thr-105TMH B and Val-162TMH C being up to 10.3 Å. Notably, the corresponding gap was much smaller in pea and maize Lhca3, with the shortest distance between PheTMH B and MetTMH C of pea Laca3, 4.1 Å, and between TyrTMH B and MetTMH C in maize Lhca3, 3.3 Å (Fig. 5b, c, region III). Therefore, amino acids in the three regions constitute candidate structural elements for the strong red shift in Fa.
To delineate the amino acids critical to the red shift in Fa, we compared the sequence of Fa Lhca3 to two available Lhca3 sequences from Acanthaceae plants, Chinese rain bell (Strobilanthes cusia) and green chiretta (Andrographis paniculata), with a comparable red shift in their λmax (Fig. 1g, h). We also compared the sequence of Fa Lhca3 to the Lhca3 sequence from 15 plant species belonging to different families outside the Acanthaceae (Supplementary Fig. 12). The sequence in region I of Lhca3 in Acanthaceae is Phe-Trp-Phe-Gln (in Fa and S. cusia) or Met-Trp-Phe-Gln (in A. paniculata), with the middle two residues having benzene ring side chains forming a large canopy; in all non-Acanthaceae species except P. notoginseng, the sequence is Gly-Phe-Ile-Glu, forming a smaller canopy as in pea and maize (Fig. 5b, region I). Region I in P. notoginseng has the sequence Ile-Phe-Phe-Glu; the third residue Phe has a larger side chain than Ile (the counterpart of non-Acanthaceae Gly-Phe-Ile-Glu), while the second residue Phe has a smaller side chain than Trp (the counterpart of Acanthaceae Phe-Trp-Phe-Gln or Met-Trp-Phe-Gln), thus likely forming a larger canopy than that in pea and maize but smaller than that in Fa. Notably, P. notoginseng had a fluorescence emission peak of 747 nm, intermediate between non-Acanthaceae land plants and Fa (Fig. 1a, b), suggesting that residues with larger side chains in region I may lead to a more red-shifted fluorescence emission spectrum.
In region II, the amino acid is polar Tyr in the three Acanthaceae plant species and P. notoginseng, and nonpolar Phe or Leu in the 14 non-Acanthaceae, suggesting that polar Tyr in region II may favor the red shift. The sequence in region III does not clearly distinguish between Acanthaceae and non-Acanthaceae, as the two non-Acanthaceae plants pineapple (Ananas comosus) and Boxelder maple (Acer negundo) have the same residues as the three Acanthaceae plants, with a Thr in TMH B and a Val in TMH C (Supplementary Fig. 12). However, these residues in region III may contribute to the energy state of red Chl dimers, as evidenced by the 77-K fluorescence emission spectra of A. comosus and A. negundo, with λmax values of 747.2 nm and 744.4 nm, representing red shifts of 12 nm and 10 nm compared to At, respectively (Supplementary Fig. 13). Therefore, all three regions likely contain structural elements that explain the strong red shift in fluorescence emission.


